

Top Processes
Plugin from JanitorHead
Overview
Readme
View on GitHubTop Processes — Unraid Dashboard Widget
A native-looking Dashboard tile for Unraid 7.x that shows the processes using the
most CPU and memory — like htop, but in Unraid's style. It fills the gap left by the
official Processor and System tiles, which tell you how much is used but never which
process is responsible.
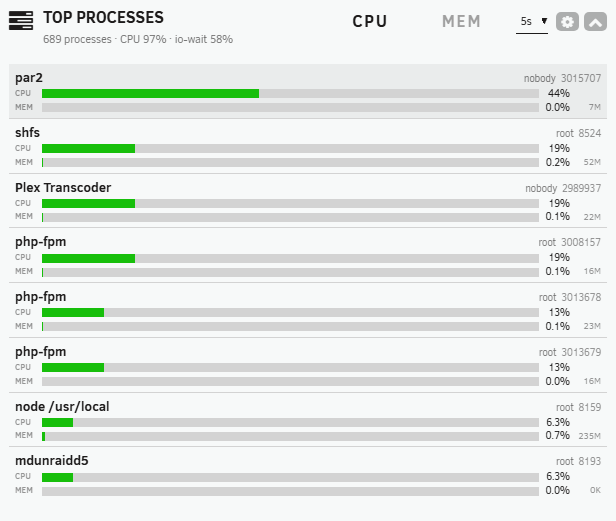
 dockerd                       root   1234
 CPU ███████████████░░░░░░░░░░░░░  42%
 MEM ██████░░░░░░░░░░░░░░░░░░░░░░  18% 512M
 shfs                          root    987
 CPU ████████████████████████████  78%
 MEM ██████████████░░░░░░░░░░░░░░  41% 1.2G
Features
- Top‑N processes with name, user and PID (full command line on hover).
- Twin CPU + RAM bars per process — two flat, square, full‑width rails that match
Unraid's native usage bars; distinguished by a
CPU/MEMlabel, with colour used only for severity (green → orange → red), plus absolute memory (e.g.1.2G). - Sort by CPU or MEM from the header tabs; native refresh selector (2 / 5 / 10 s / off) just like the Processor tile's “30 s” dropdown.
- Accurate %CPU from
/proc(htop/Irix — 100 % = one core), including kernel threads (ZFS, md, kworker…) so the real culprit shows — not the misleading dashboard average. A header readout (CPU X% · io‑wait Y%) reconciles with the official Processor tile and surfaces disk‑wait (which belongs to no process). Kernel threads are toggleable in Settings. - Themes: tracks white / black / gray / azure via Unraid's CSS tokens.
- Light on resources: a stateful endpoint does a single
/procwalk and computes CPU as a delta (no blocking sleep); the tile polls only while it's visible and expanded (pauses when collapsed, off‑screen, or the tab is hidden). No background daemon.
Install
Unraid → Plugins → Install Plugin → paste:
https://raw.githubusercontent.com/JanitorHead/unraid-topprocesses/master/topprocesses.plg
Then open the Dashboard — the Top Processes tile appears in the left column. Defaults (rows, sort, interval) live in Settings → Utilities → Top Processes. The plugin is self‑contained (every file embedded inline) and auto‑updates from this repo.
How %CPU is measured
Computed from /proc using htop's Irix semantics, so 100 % means one full core. This
avoids the well‑known “100 % in the dashboard, 15 % in htop” discrepancy. Cross‑check on
the console with top -bn1 -o %CPU | head -n 20.
Building / contributing
topprocesses.plg is generated from source/ — never hand‑edit it. After changing
anything under source/topprocesses/…, regenerate with a new version:
build/make-standalone-plg.sh # writes topprocesses.plg from source/ (version = today's date)
Fastest iteration on a live box (skip packaging): copy the staging tree onto the server and refresh the Dashboard:
scp -r source/topprocesses/usr/local/emhttp/plugins/topprocesses root@TOWER:/usr/local/emhttp/plugins/
License
MIT.
Media gallery
Categories
Download Statistics
Downloads by Month
Related apps
Explore more like this
Explore allDetails
https://raw.githubusercontent.com/JanitorHead/unraid-topprocesses/master/topprocesses.plg