

Tidemark
Docker app from FoggyMtnDrifter's Repository
Overview
First run: start the container, open the WebUI, and visit /install to create your admin account (SQLite needs no setup; MySQL, MariaDB and PostgreSQL work too). Everything lives in the appdata folder. Put it behind a reverse proxy for HTTPS and set Public address to match. Update by pulling a newer image; migrations run on the first visit.
Questions? Join the community on Discord: https://discord.gg/sCkHD3PPZh
Readme
View on GitHub

 Latest release License: MIT Community
As seen on Open Source Alternatives Tidemark Analytics | AlternativeTo
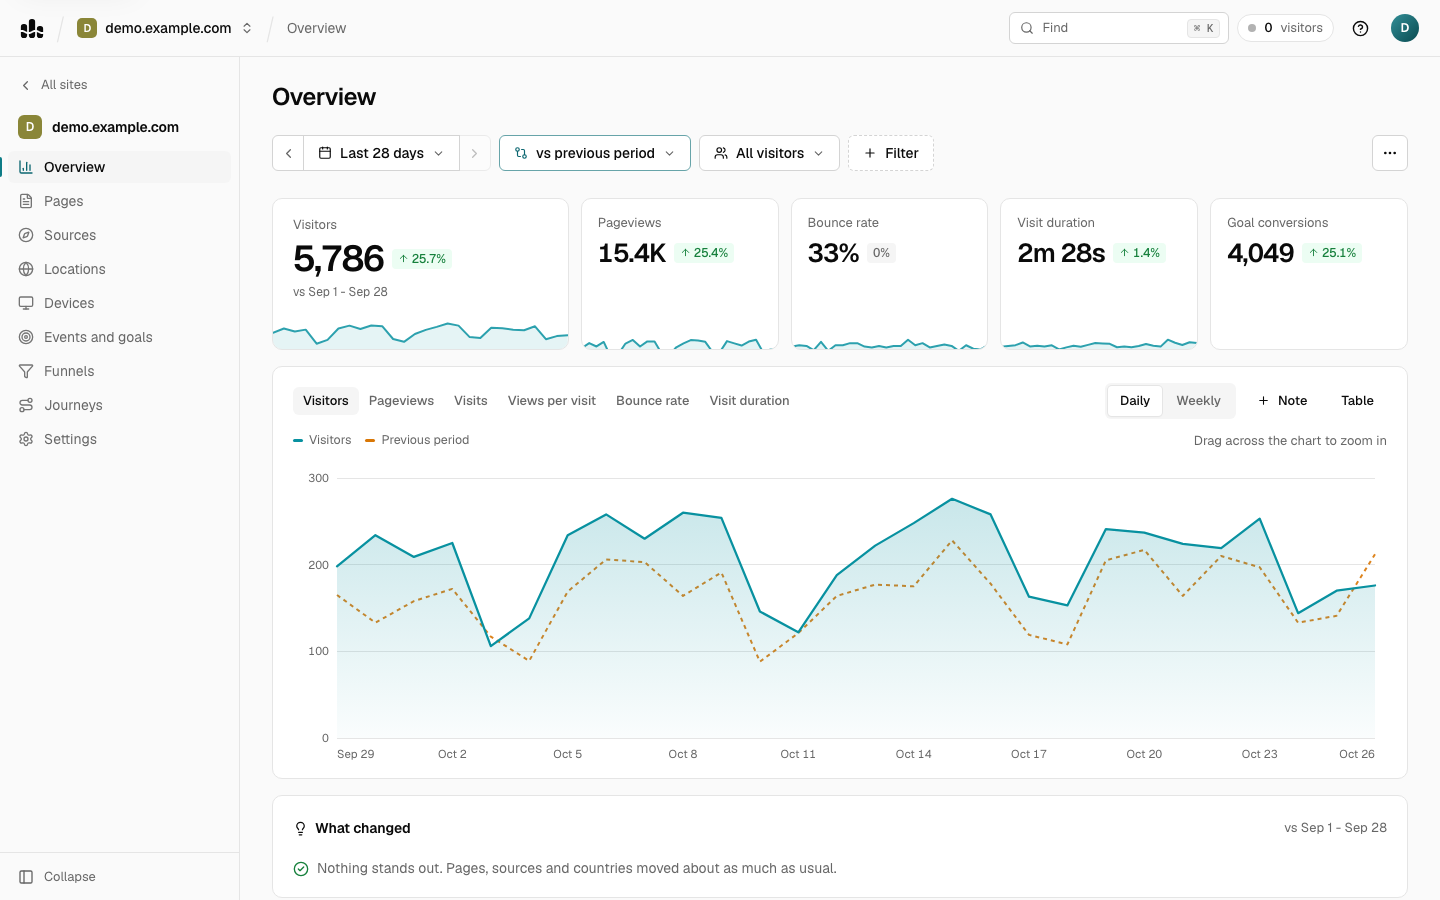
Tidemark Analytics is simple, privacy-first web analytics that runs on ordinary PHP shared hosting. One light dashboard in the spirit of
Plausible, built with Laravel — upload a zip, open /install, done. No Node, no Docker, no SSH required.
- Cookie-free, no personal data: visitor ids are a salted hash that rotates every day, and IP addresses are never written to the database
- One page, everything on it: visitors, visits, pageviews, views per visit, bounce rate and visit duration, with sources, pages, locations, devices and goals underneath
- Plausible-compatible tracking script and Events API (
data-domain,window.plausible(...),script.outbound-links.js-style variants) - Import your history from Plausible's CSV export
- Works on SQLite, MySQL/MariaDB and PostgreSQL
- Designed to scale out later: swappable event sink, separate analytics database connection, stateless app tier
Don't want to run it yourself? Tidemark Cloud
The same open-source Tidemark Analytics, hosted for you at tidemarkanalytics.com: no server, no updates, nothing to install. Sign up, paste one line into your site's <head>, and your dashboard is ready.
- Free to start: 1 site, 10,000 events a month and 6 months of history, with every report, filter, goal and shared link.
- Pro, $7 a month ($70 a year): unlimited sites, 250,000 events a month, 5 years of history, funnels, revenue, segments, journeys, rollups, alerts and webhooks, and your own logo and color on public dashboards. Need more events? Add packs of 250,000 for $5 whenever you like.
- Still private by design: no cookies and no stored IP addresses, and direct support from inside the app.
- Switching? Import your history from Plausible's CSV export.
Try the live demo · See pricing · Start free
Prefer to host it yourself? Everything below is for you, and it is free under the MIT license.
Install on shared hosting (no SSH)
Download the latest
tidemark-x.y.z.zipfrom Releases (dependencies are bundled), or build it yourself:scripts/build-release.sh 0.8.0→dist/tidemark-0.8.0.zip.Upload and unzip it on your host. Point the domain's document root at the
public/folder. If your host won't let you, upload to the web root as-is — the bundled root.htaccessforwards topublic/and blocks internals.Visit
https://your-domain/install: the page checks the server, connects your database (SQLite needs no setup), runs the migrations and creates your admin account.Add a cron job (cPanel → Cron Jobs) — only needed for queue ingestion and data retention:
* * * * * php /home/you/tidemark/artisan schedule:run >> /dev/null 2>&1Add a site and paste the snippet into your site's
<head>. The dashboard waits for the first pageview and then opens by itself.
Requirements: PHP 8.3+, mbstring, openssl, pdo + one of pdo_sqlite / pdo_mysql / pdo_pgsql, fileinfo, ctype, tokenizer, xml.
Install with Docker
A pre-built image for amd64 and arm64 is published to ghcr.io/tidemark-apps/analytics. With the docker-compose.yml in this repository:
docker compose up -d
then open http://localhost:8080/install to create your admin account. Everything that changes lives in the /data volume (settings, the SQLite database, logs), the scheduler runs inside the container, and you update by pulling a newer image (docker compose pull && docker compose up -d); migrations run on the first request. Set PUID/PGID to run as a different user (Unraid uses 99/100). MySQL, MariaDB and PostgreSQL work too: choose them in the installer and point them at your database container.
Local development
composer install && cp .env.example .env && php artisan key:generate
touch database/database.sqlite && php artisan migrate
php artisan tidemark:demo        # fake traffic for demo.example.com; login demo@example.com / password
php artisan serve
php artisan test
Updating
Sign in as an administrator, open Account settings → Updates and Tidemark shows when a newer release exists on GitHub; Download and install fetches it, checks its SHA-256 checksum and installs it. Tidemark looks for new releases daily, and every few hours while an administrator is using the app, and shows a dot by your profile when one is out; only the latest version number is requested. Set TIDEMARK_UPDATE_CHECK=false to turn that off, or TIDEMARK_UPDATE_REPO to follow a fork. You can also upload a release zip (tidemark-x.y.z.zip) yourself. Either way Tidemark validates the zip, backs up the current code to storage/app/updates/backups/, replaces the application files (never .env, storage/ or your database), then runs the database migrations on the next request. The upload is sent in small pieces, so low PHP upload limits don't matter. It needs PHP's zip extension and a folder PHP can write to; otherwise upload the release over FTP as usual and visit the site once to run migrations. scripts/build-release.sh <version> stamps the version into the zip.
Tracking
<script defer data-domain="example.com" src="https://your-tidemark.example/js/script.js"></script>
Pageviews are sent on load and on every history change, so single-page apps work without extra code. Optional behavior is picked by
the file name — combine as many as you like (script.outbound-links.file-downloads.js):
| Variant | Adds |
|---|---|
outbound-links |
Outbound Link: Click events (url property) |
file-downloads |
File Download events (url property) |
form-submissions |
Form: Submission events |
engagement |
one Engagement event per page view with how far down the page the visitor scrolled and how long they were active (details) |
tagged-events |
click events from class="plausible-event-name=Signup" |
hash |
pageviews on #hash route changes |
manual |
no automatic pageviews; call plausible('pageview') yourself |
local |
also track localhost |
Site settings → General picks the right file name for you. Custom events and properties:
plausible('Signup', { props: { plan: 'pro' }, callback: () => {} })
Create a matching goal (custom event or page) in the site's settings to see it under Behaviors. Use data-api="https://…/api/event" to send through a proxy on your own domain.
Anything that speaks Plausible's Events API works too: POST /api/event with {"n": "pageview", "u": "https://example.com/", "d": "example.com", "r": null, "w": 1280, "p": {…}}.
Scroll depth and time on page
The engagement variant (Site settings → Tracking → Scroll depth and time on page, or add .engagement to the file name) answers "did they read it?" with numbers only: no element, text or position is ever captured. When a visitor leaves a page or switches tab, the script sends one Engagement event with two properties:
| Property | Values |
|---|---|
depth |
the furthest milestone reached: 0, 25, 50, 75 or 100 (percent of the page). A page that fits on one screen is 100. |
time |
active time on the page: 0-10s, 10-30s, 30-60s, 1-3m or 3m+ |
Add an Engagement goal (turning the setting on creates it), then open it under Behaviors to see how many visitors reached each depth and time, or filter any report by those properties, in goals and funnels too. Good to know:
- The event is not an interaction, so bounce rate and visit duration don't change, and it is stored as one row per page view however often the visitor comes and goes (the latest totals win). It does count as one extra event per page view.
- Active time stops after a minute without scrolling, moving the mouse, typing or touching the screen, and only counts while the tab is visible.
- Single-page apps are measured per route change. A measurement that arrives more than 30 minutes after the visit's last hit is dropped rather than starting a visit of its own.
- Send your own with
plausible('Name', { interactive: false })or"i": 0in the Events API.
What's included
- Dashboard — the six headline metrics with comparison (previous period or year over year), a graph with hour/day/week/month intervals, and a view as table twin.
- Reports — Sources (channels, sources, UTM campaigns), Pages (top, entry, exit), Locations (world map, countries, regions, cities), Devices (browsers, operating systems, device types), Behaviors (goals, custom properties). Every list has a Details view with search and paging.
- Filters — click any row, or use Filter: is, is not, contains, does not contain, wildcards (
/blog/*), several values per filter. Filtering by a goal switches the dashboard into conversion mode. - Periods — today, realtime, 24 hours, 7/28/30/91 days, month, 6/12 months, year, all time, custom; keyboard shortcuts for all of them (
D R W T Q M S L Y A C,Xcompare,Ffilter,←/→step through days, months or years). - Sharing — make a dashboard public, or create private shared links with an optional password.
- Goals, shields, people — conversion goals, block rules (IP, country, page, hostname allow-list), owner/admin/viewer roles per site, teams (group people once and share a site with the whole team as viewers or admins) and organizations (everyone has a Personal one; create others with an owner, admins and teams, and hand one over by transferring ownership).
- CSV export, a Stats API, API keys, and two-factor sign-in with an authenticator app, email codes or passkeys.
Brand
Logo (pictorial mark: pier pilings with a tide line across them), palette, typography, voice, naming rules and marketing copy are documented in resources/brand/index.html (open it through any static server, e.g. python3 -m http.server from the project root, then visit /resources/brand/). The logo set and contour motif are generated by scripts/build-brand.py; PNG/favicon exports by scripts/export-brand-png.sh. Source of truth for colors is public/assets/app.css.
Interface notes
- Layout: a sidebar lists your sites and the sections of the open dashboard (Overview, Traffic, Audience, Conversions) and opens a ⌘K command palette; one dashboard per site at
/{domain}. It opens with a plain-language summary and six KPI tiles, with a sticky toolbar for current visitors, Filter, the date picker and a ⋮ menu (interval, CSV export, settings). Narrow screens use a top bar instead of the sidebar. - Charts: hairline grids, one tooltip with the comparison series, keyboard control (←/→) and a View as table twin. Refetching dims the previous render instead of flashing skeletons.
- Colors: deep-water neutrals with Tide teal as the interface color and Buoy amber as the signal. Chart series (
--series-1Lagoon teal,--series-2amber) pass the palette validator on both themes — light#0891a0/#d97706, dark#1fa3a8/#cf7f0c. Re-validate if you change them. - Accessibility: visible focus rings, focus-trapped dialogs, labeled controls,
prefers-reduced-motionand forced-colors support, light/dark/system themes. - Fonts: Inter is self-hosted (
public/assets/fonts, SIL OFL) — no third-party requests.
Configuration (.env)
| Variable | Default | Notes |
|---|---|---|
TIDEMARK_REGISTRATION |
false |
Allow sign-ups |
TIDEMARK_INVITES |
false |
Let site owners invite people who have no account by e-mail (needs working MAIL_* settings). Invitations expire after TIDEMARK_INVITE_HOURS (default 72) |
TIDEMARK_INGEST |
sync |
queue buffers writes; drained by schedule:run or a worker |
TIDEMARK_ANALYTICS_DB |
(app DB) | Separate connection for visits, events and event_props |
TIDEMARK_IGNORE_IP, TIDEMARK_HOSTNAMES |
– | Comma-separated lists |
TIDEMARK_RETENTION_DAYS |
0 |
Delete raw data older than N days (daily via scheduler) |
TIDEMARK_GEOIP_DATABASE |
storage/app/geo/GeoLite2-City.mmdb |
Needs composer require geoip2/geoip2; Cloudflare/Vercel/CloudFront geo headers work with no setup |
TIDEMARK_MAX_SITES |
0 |
Sites per user. 0 is unlimited |
TIDEMARK_UPDATER |
true |
false hides Account settings → Updates and disables its endpoints |
TIDEMARK_TERMS_URL, TIDEMARK_PRIVACY_URL, TIDEMARK_REFUNDS_URL |
– | Links to your legal pages, shown on the sign-in and sign-up screens |
TIDEMARK_VERIFY_EMAIL |
false |
New accounts must confirm their email before adding sites (needs MAIL_* settings) |
Behind a CDN (Cloudflare etc.) the real client IP and country are read from its headers automatically.
Stats API
Create a key under Account settings → API keys and send it as Authorization: Bearer …. site_id is the site's domain; the query format follows Plausible's Stats API v1.
GET /api/v1/stats/realtime/visitors?site_id=example.com
GET /api/v1/stats/aggregate?site_id=example.com&period=30d&metrics=visitors,pageviews,bounce_rate
GET /api/v1/stats/timeseries?site_id=example.com&period=30d&metrics=visitors
GET /api/v1/stats/breakdown?site_id=example.com&period=30d&property=visit:source&limit=10
Filters use filters=visit:country==DE;event:page==/blog/*. The dashboard's own JSON endpoints live under /api/sites/{domain}/stats/….
Architecture
 browser ──► POST /api/event ──► Collector ──► EventSink ──► analytics DB (visits, events, event_props)
                                    │           ├─ DatabaseSink  (default: write in-request, stitches visits)
                                    │           └─ QueueSink     (buffer → worker → DatabaseSink)
 dashboard (Preact, no build) ──► JSON API ──► Stats engine (Period + Filters) ──► analytics DB
                                                └─ metadata DB (users, sites, goals, shared links, shields)
- Visits, not sessions. A visit is one row, stitched in the sink: hits from the same visitor within 30 minutes of inactivity extend it (entry/exit page, pageviews, bounce, duration). Reports read visits for most numbers and events for pageviews and goals.
- Two logical databases. Hot, append-only tables go through
TIDEMARK_ANALYTICS_DB, everything else through the default connection. Tables are keyed bysite_idand indexed on time, so they partition and shard naturally. - Stateless app tier. Sessions and cache can move to Redis/DB; any number of PHP workers can serve requests.
- Swappable seams.
EventSink(writes) andStats\Stats(reads) are the only places that know about the storage engine — a ClickHouse implementation can replace them without touching controllers or the UI. - Privacy by construction. Visitor ids are
hash(site, ip, user-agent, daily salt); raw IPs and user agents are never stored, and because the salt changes every day a visitor cannot be followed from one day to the next.
Project name
Tidemark — a tidemark is the line a tide leaves behind on a shore or harbor wall: a record of how high the water reached, kept without keeping the water. That is the product's privacy model in one image: it keeps the aggregate line and never the footprints of individual visitors.
Icons
Icons are Lucide (ISC license), served from one self-hosted sprite at public/assets/icons.svg (only the icons in scripts/icons.txt). To add one: add its Lucide name to scripts/icons.txt, then npm i --no-save lucide-static && node scripts/build-icons.mjs. Use it with <${Icon} name="chart-column" />.
License
MIT
Community
Questions, ideas and show-and-tell: join the Tidemark community. Bugs belong in GitHub issues.
Contributing
See CONTRIBUTING.md. Security issues: SECURITY.md. Releases are built by GitHub Actions when a vX.Y.Z tag is pushed (the tag must match the VERSION file).
Media gallery
1 / 10Requirements
Categories
Related apps
Explore more like this
Explore allDetails
ghcr.io/tidemark-analytics/tidemark:latestRuntime arguments
- Web UI
http://[IP]:[PORT:8080]- Network
bridge- Shell
sh- Privileged
- false
Template configuration
Port for the Tidemark dashboard and the tracking script.
- Target
- 8080
- Default
- 8080
- Value
- 8080
Settings, the SQLite database, logs and uploads. Back this folder up.
- Target
- /data
- Default
- /mnt/user/appdata/tidemark
- Value
- /mnt/user/appdata/tidemark
The address people and your websites use to reach Tidemark, such as https://stats.example.com. It appears in the tracking snippet and in links.
- Target
- APP_URL
- Default
- http://tower:8080
- Value
- http://tower:8080
User id the app runs as. Unraid's nobody is 99.
- Default
- 99
- Value
- 99
Group id the app runs as. Unraid's users is 100.
- Default
- 100
- Value
- 100
Delete raw visits and events older than this many days. 0 keeps everything.
- Target
- TIDEMARK_RETENTION_DAYS
- Default
- 0
- Value
- 0
Use smtp to send password reset and invitation emails. The default only writes them to the log.
- Target
- MAIL_MAILER
- Default
- log
- Value
- log
SMTP server, when the mail driver is smtp.
- Target
- MAIL_HOST
SMTP port.
- Target
- MAIL_PORT
- Default
- 587
- Value
- 587
SMTP username.
- Target
- MAIL_USERNAME
SMTP password.
- Target
- MAIL_PASSWORD
The address emails are sent from.
- Target
- MAIL_FROM_ADDRESS