
All apps · 0 apps

scrutiny-collector-performance
Docker app from Starosdev's Repository
Overview
Readme
View on GitHub

Scrutiny





Hard Drive Health Dashboard & Monitoring for S.M.A.R.T metrics
Why This Fork?
This fork exists to keep Scrutiny alive and growing. The original AnalogJ/scrutiny project development slowed significantly in 2024, while community contributions and feature requests continued to grow. This fork picks up where the original left off, merging pending community PRs and adding new features.
Full credit for the original vision and architecture goes to AnalogJ. I started this fork as a learning project, so contributions from more experienced developers are greatly appreciated. All changes are reviewed before merging.
| Original | This Fork | |
|---|---|---|
| Latest Version | v0.8.1 (Apr 2024) |  |
| Frontend | Angular 13 | Angular 21 |
| Status | Minimal updates | Actively maintained |
| Community PRs | Many pending | Merged |
What's New in This Fork
- ZFS Pool Monitoring - Monitor ZFS pool health alongside individual drives
- Prometheus Metrics - Export metrics to Prometheus for advanced monitoring
- Device Archiving - Hide decommissioned drives without deleting history
- Per-Device Notification Control - Mute notifications for specific devices
- Device Labels - Add custom labels to drives via UI or collector config file
- Day-Resolution Temperature Graphs - More granular temperature history
- SAS Temperature Support - Proper temperature readings for SAS drives
- SCT Temperature History Toggle - Control SCT ERC settings per drive
- S.M.A.R.T Attribute Overrides - Override manufacturer thresholds via UI or config
- Improved Dashboard Layout - Sidebar navigation moved to top for better attribute visibility
- Enhanced Mobile UI - Dedicated mobile layout with bottom tab bar navigation, unified health overview home screen, card-based SMART attributes and workload views, and badge indicators for drives needing attention
- Performance Benchmarking - Run fio benchmarks and track drive throughput, IOPS, and latency over time
- Scheduled Reports [WIP] - Automated daily/weekly/monthly health reports via email with HTML formatting
- API Authentication - Opt-in token-based auth for API, web UI, and Prometheus metrics
- Missed Ping Digest - Consolidated notification when multiple collectors miss pings (instead of one email per device)
- HTML Email Notifications - Rich HTML emails with plain-text fallback for reports, test notifications, collector errors, missed ping digests, and other alert emails over SMTP
- Enhanced Seagate Drive Support - Better timeout handling and FARM log collection for Seagate drives
- Workload Insights - Visualize daily read/write rates, I/O intensity, SSD endurance, and activity spike detection
- Home Assistant MQTT Discovery - Native MQTT integration for automatic device discovery in Home Assistant
- UI-Configurable Notification URLs - Add, edit, test, and delete notification endpoints directly in the web UI
- Uptime Kuma Push Monitor - Dedicated push-based integration for Uptime Kuma status monitoring
- SHA256 Checksums - Verify release binary integrity
Release Schedule
We follow a predictable release cadence to balance new features with stability:
| When | What | Channel |
|---|---|---|
| Sunday | Integration testing and maintainer validation | Testing (:develop) |
| Saturday | New features and release candidates | Beta (:beta) |
| Monthly | Promote mature beta features to stable | Stable (:latest) |
| As needed | Critical hotfixes and urgent security patches | Stable (:latest) |
Releases are created manually, not on every commit. Track upcoming work on the Release Schedule project board.
Deployments
This repository also owns the testing and production deployment definitions for Scrutiny.
- Testing images publish from the
developbranch throughDeploy Testing Stack - Beta images publish from the
betabranch throughPublish Beta Image - Production deploys from the
masterbranch throughAutomated Release and Deploy betais an optional pre-release channel for features that need validation before going tomaster- Zeus currently runs separate develop, beta, and production host appdata trees:
- develop:
/mnt/user/appdata/scrutiny-develop - beta:
/mnt/user/appdata/scrutiny-beta - production:
/mnt/user/appdata/scrutiny
- develop:
- Zeus host-side deploy helpers target the live appdata-root compose files, not the repo
deploy/*example compose files:- develop helper:
/mnt/user/appdata/scrutiny-develop/docker-compose.yml - production helper:
/mnt/user/appdata/scrutiny/docker-compose.yml
- develop helper:
- Host smoke checks require
/api/healthto return200, while the root path may legitimately redirect depending on auth or proxy behavior. - Deployment compose files, env templates, and host expectations live in docs/DEPLOYMENTS.md
Loop pilot
This repo includes a loop pilot for PR flow, issue triage, and dependency hygiene.
- Control docs:
LOOP.md,STATE.md,loop-budget.md - Scheduled triage:
.github/workflows/loop-pilot-triage.yaml - Manual draft-only analyzers:
- Actions run names:
Loop Pilot TriageLoop Pilot PR BabysitterLoop Pilot Dependency Sweeper
- Default-branch dispatch: available from GitHub Actions on
master
The pilot is intentionally draft-only for action loops: it can summarize blockers and produce artifacts, but it does not commit, push, merge, label, or comment on PRs.
Introduction
If you run a server with more than a couple of hard drives, you're probably already familiar with S.M.A.R.T and the smartd daemon. If not, it's an incredible open source project described as the following:
smartd is a daemon that monitors the Self-Monitoring, Analysis and Reporting Technology (SMART) system built into many ATA, IDE and SCSI-3 hard drives. The purpose of SMART is to monitor the reliability of the hard drive and predict drive failures, and to carry out different types of drive self-tests.
These S.M.A.R.T hard drive self-tests can help you detect and replace failing hard drives before they cause permanent data loss. However, there's a couple issues with smartd:
- There are more than a hundred S.M.A.R.T attributes, however
smartddoes not differentiate between critical and informational metrics smartddoes not record S.M.A.R.T attribute history, so it can be hard to determine if an attribute is degrading slowly over time.- S.M.A.R.T attribute thresholds are set by the manufacturer. In some cases these thresholds are unset, or are so high that they can only be used to confirm a failed drive, rather than detecting a drive about to fail.
smartdis a command line only tool. For head-less servers a web UI would be more valuable.
Scrutiny is a Hard Drive Health Dashboard & Monitoring solution, merging manufacturer provided S.M.A.R.T metrics with real-world failure rates.
Features
Core Features
- Web UI Dashboard - focused on Critical metrics
smartdintegration (no re-inventing the wheel)- Auto-detection of all connected hard-drives
- S.M.A.R.T metric tracking for historical trends
- Customized thresholds using real world failure rates
- Temperature tracking with configurable resolution
- Provided as an all-in-one Docker image (but can be installed manually)
- Configurable Alerting/Notifications via Webhooks
Extended Features (This Fork)
- ZFS Pool Monitoring - Track pool health, capacity, and status
- Prometheus Metrics Endpoint -
/api/metricsfor Grafana integration - Device Archiving - Archive old drives to declutter the dashboard
- Per-Device Notification Muting - Control which drives trigger alerts
- Custom Device Labels - Add meaningful names via UI or set persistent labels in collector config
- Day-Resolution Graphs - View temperature trends at daily granularity
- SAS Drive Support - Full temperature support for SAS devices
- S.M.A.R.T Attribute Overrides - Override thresholds per device via UI
- API Authentication - Token and password login, collector auth, independent metrics auth
- Improved UI Layout - Top navigation for better S.M.A.R.T attribute visibility
- Mobile-Optimized Interface - Bottom tab bar (Home, Drives, ZFS, Workload, Settings), health overview home tab, card-based data views, and responsive layouts below 960px
- API Timeout Configuration - Adjust timeouts for slow storage systems
- Performance Benchmarking - fio-based benchmarks for throughput, IOPS, and latency with historical tracking
- ATA Self-Test History - Persist and display recent ATA SMART self-test log entries on device detail pages
- Scheduled Reports [WIP] - Automated health reports on daily/weekly/monthly schedules with HTML emails and PDF export
- Missed Ping Digest - Batch notification when multiple collectors go unreachable
- HTML Email Notifications - Rich HTML formatting with plain-text fallback for SMTP notifications, including reports, test notifications, collector errors, missed ping digests, heartbeat, performance degradation, replacement risk, and MDADM degradation alerts
- Workload Insights - Daily read/write rates, R/W ratio, I/O intensity classification, SSD endurance tracking, and activity spike detection
- Consumer Drive Profiles - Apply vetted ATA HDD and SSD profiles based on Backblaze-informed thresholds, with opt-out controls and replacement-risk transparency
- Filesystem Capacity Monitoring - Track logical filesystem free space independently from SMART device health
- MDADM Monitoring - Monitor Linux software RAID arrays with a dedicated collector
- Btrfs Filesystem Monitoring - Track Btrfs health, scrub status, topology, and usage details
- Home Assistant MQTT Discovery - Native push-based integration with automatic entity creation (temperature, health status, power-on hours, power cycles, drive problem)
- Heartbeat Notifications - Periodic "all clear" alerts for uptime monitoring integration
- Uptime Kuma Push Monitor - Dedicated push-based health status updates to Uptime Kuma endpoints
- Seagate FARM Log Support - Collect Field Accessible Reliability Metrics from Seagate Exos, IronWolf, and BarraCuda drives
- UI-Configurable Notification URLs - Manage notification endpoints directly in the web UI (add, edit, test, delete)
- Collector-Side Error Notifications - Receive alerts when smartctl fails to read a drive during collection, not just when SMART attribute thresholds are exceeded
API Documentation
The Scrutiny API is now documented from a canonical OpenAPI spec:
- OpenAPI: docs/openapi.yaml
- Swagger UI: docs/swagger-ui.html
- Overview: docs/API.md
- Served Swagger UI:
/docs/api - Served OpenAPI spec:
/api/docs/openapi.yaml - Runtime auth default: docs/spec are auth-gated unless
web.docs.public=true
If you change a route in webapp/backend/pkg/web/server.go, update docs/openapi.yaml in the same change.
Migration from AnalogJ/scrutiny
If you're currently using the original AnalogJ/scrutiny, migrating is straightforward:
- Update your image reference from
ghcr.io/analogj/scrutinytoghcr.io/starosdev/scrutiny - Data is compatible - Your existing SQLite database and InfluxDB data will work without changes
- Config files are compatible - No changes needed to
scrutiny.yamlorcollector.yaml
That's it! The fork maintains full backwards compatibility with the original project.
Getting Started
Optional: CodeGraph
If you want repo-local code navigation in this checkout, initialize CodeGraph from the repo root:
codegraph init .
The .codegraph/ directory is local-only and gitignored. Create it separately in each worktree where you want the index. Once it exists, use codegraph_explore when the MCP tool is available or codegraph explore "<symbol names or question>" from the shell.
RAID/Virtual Drives
Scrutiny uses smartctl --scan to detect devices/drives.
- All RAID controllers supported by
smartctlare automatically supported by Scrutiny.- While some RAID controllers support passing through the underlying SMART data to
smartctlothers do not. - In some cases
--scandoes not correctly detect the device type, returning incomplete SMART data. Scrutiny supports overriding detected device type via the config file: see example.collector.yaml
- While some RAID controllers support passing through the underlying SMART data to
- If you use docker, you must pass though the RAID virtual disk to the container using
--device(see below)- This device may be in
/dev/*or/dev/bus/*. - If you're unsure, run
smartctl --scanon your host, and pass all listed devices to the container.
- This device may be in
See docs/TROUBLESHOOTING_DEVICE_COLLECTOR.md for help
Docker
If you're using Docker, getting started is as simple as running the following command:
In this fork, "local Docker testing" means the Zeus Unraid host, not this Mac.
Run containerized Scrutiny tests on Zeus over LAN 192.168.1.33 or NetBird
100.66.106.240, and treat the repo deploy/* files as examples unless a doc
explicitly points you at the live Zeus appdata compose files.
For a component-level overview of how Omnibus and Hub/Spoke fit together, see docs/ARCHITECTURE.md.
See docker/example.omnibus.docker-compose.yml for a docker-compose file.
Existing Omnibus installations upgrading to InfluxDB 2.9.1: Stop Scrutiny and back up the complete host directory mounted at
/opt/scrutiny/influxdbbefore starting the new image. Then setSCRUTINY_INFLUXDB_29_BACKUP_CONFIRMED=true. The container blocks InfluxDB startup until this acknowledgement is provided. Fresh installations do not require it. See Omnibus InfluxDB 2.9 upgrade preflight.
docker run -p 8080:8080 -p 8086:8086 --restart unless-stopped \
  -v `pwd`/scrutiny:/opt/scrutiny/config \
  -v `pwd`/influxdb2:/opt/scrutiny/influxdb \
  -e SCRUTINY_INFLUXDB_29_BACKUP_CONFIRMED=false \
  -v /run/udev:/run/udev:ro \
  --cap-add SYS_RAWIO \
  --device=/dev/sda \
  --device=/dev/sdb \
  --name scrutiny \
  ghcr.io/starosdev/scrutiny:latest-omnibus
/run/udevis necessary to provide the Scrutiny collector with access to your device metadata--cap-add SYS_RAWIOis necessary to allowsmartctlpermission to query your device SMART data- NOTE: If you have NVMe drives, you must add
--cap-add SYS_ADMINas well.
- NOTE: If you have NVMe drives, you must add
--deviceentries are required to ensure that your hard disk devices are accessible within the container.ghcr.io/starosdev/scrutiny:latest-omnibusis an omnibus image, containing both the webapp server (frontend & api) as well as the S.M.A.R.T metric collector. (see below)
Hub/Spoke Deployment
In addition to the Omnibus image (available under the latest tag) you can deploy in Hub/Spoke mode using
the following Docker images:
ghcr.io/starosdev/scrutiny:latest-collector- Contains the Scrutiny data collector,smartctlbinary and cron-like scheduler. You can run one collector on each server.ghcr.io/starosdev/scrutiny:latest-collector-omnibus- Recommended single-spoke image for hub/spoke deployments. Bundles the SMART, ZFS, MDADM, Btrfs, filesystem, and performance collectors in one container while keeping each optional collector disabled until you enable its existing schedule or run-on-startup env vars.ghcr.io/starosdev/scrutiny:latest-collector-zfs- ZFS pool collector for monitoring ZFS health. Run alongside or instead of the standard collector if you use ZFS. See docs/ZFS_POOL_MONITORING.md for setup instructions.ghcr.io/starosdev/scrutiny:latest-collector-mdadm- MDADM collector for Linux software RAID monitoring. See docs/MDADM_MONITORING.md for setup instructions.ghcr.io/starosdev/scrutiny:latest-collector-btrfs- Btrfs filesystem health collector. See docs/BTRFS_FILESYSTEM_MONITORING.md for setup instructions.ghcr.io/starosdev/scrutiny:latest-collector-performance- Performance benchmark collector using fio. Runs periodic benchmarks and tracks throughput, IOPS, and latency over time. See Performance Benchmarking for details.ghcr.io/starosdev/scrutiny:latest-web- Contains the Web UI and API. Only one container necessaryinfluxdb:2.9- InfluxDB image, used by the Web container to persist SMART data. Only one container necessary. See docs/TROUBLESHOOTING_INFLUXDB.md
Branch channel tags follow the same pattern across images:
develop-*from thedevelopbranchbeta-*from thebetabranchlatest-*and semver tags frommasterand release tags
Default CI image publishing currently builds:
collectorforlinux/amd64,linux/arm64, andlinux/arm/v7collector-omnibus,web,collector-zfs,collector-mdadm,collector-btrfs, andcollector-performanceforlinux/amd64andlinux/arm64
See docker/example.hubspoke.docker-compose.yml for a docker-compose file.
docker run -p 8086:8086 --restart unless-stopped \
  -v `pwd`/influxdb2:/var/lib/influxdb2 \
  -e INFLUXD_USE_HASHED_TOKENS=false \
  --name scrutiny-influxdb \
  influxdb:2.9

docker run -p 8080:8080 --restart unless-stopped \
  -v `pwd`/scrutiny:/opt/scrutiny/config \
  --name scrutiny-web \
  ghcr.io/starosdev/scrutiny:latest-web

docker run --restart unless-stopped \
  -v /run/udev:/run/udev:ro \
  --cap-add SYS_RAWIO \
  --cap-add SYS_ADMIN \
  --device=/dev/sda \
  --device=/dev/sdb \
  -e COLLECTOR_API_ENDPOINT=http://SCRUTINY_WEB_IPADDRESS:8080 \
  --name scrutiny-collector \
  ghcr.io/starosdev/scrutiny:latest-collector-omnibus
Use ghcr.io/starosdev/scrutiny:latest-collector instead if you only want the SMART collector in that spoke and do not
need the extra host tooling for ZFS, MDADM, Btrfs, filesystem, or fio workloads.
Manual Installation (without-Docker)
While the easiest way to get started with Scrutiny is using Docker (see above), it is possible to run it manually without much work. You can even mix and match, using Docker for one component and a manual installation for the other.
See docs/INSTALL_MANUAL.md for instructions.
Usage
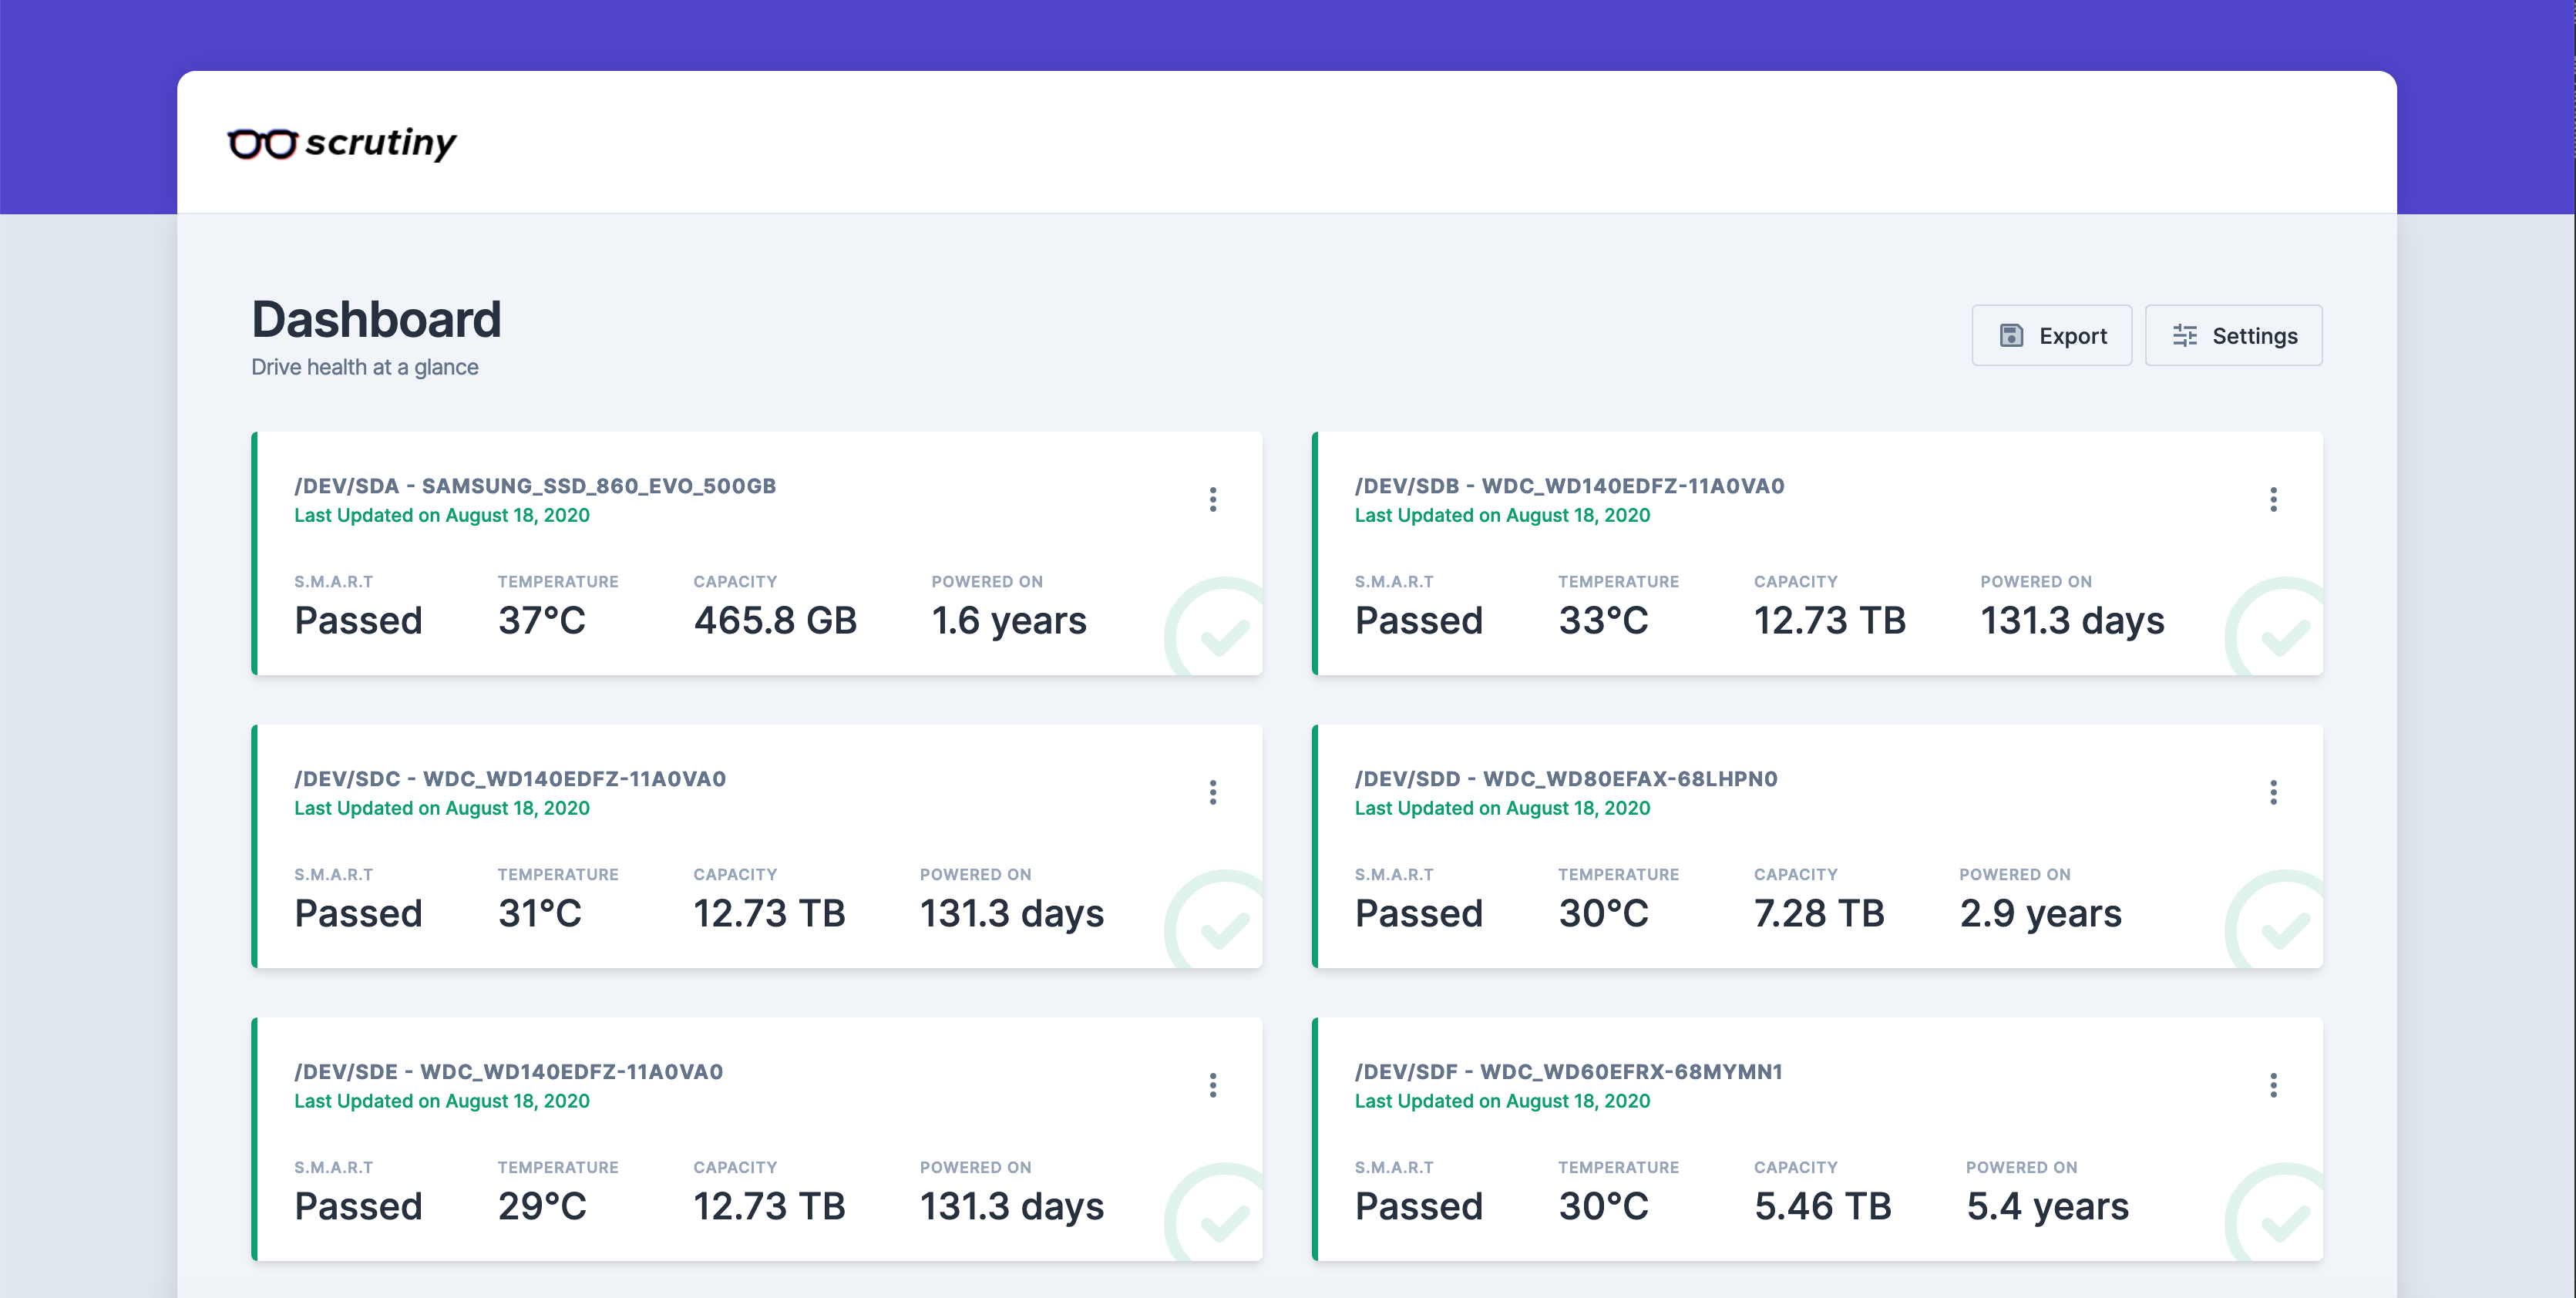
Once scrutiny is running, you can open your browser to http://localhost:8080 and take a look at the dashboard.
If you're using the omnibus image, the collector should already have run, and your dashboard should be populate with every drive that Scrutiny detected. The collector is configured to run once a day, but you can trigger it manually by running the command below.
For users of the docker Hub/Spoke deployment or manual install: initially the dashboard will be empty. After the first collector run, you'll be greeted with a list of all your hard drives and their current smart status.
docker exec scrutiny /opt/scrutiny/bin/scrutiny-collector-metrics run
Configuration
By default Scrutiny looks for its YAML configuration files in /opt/scrutiny/config
There are four primary configuration files available:
- Webapp/API config via
scrutiny.yaml- example.scrutiny.yaml. - Collector config via
collector.yaml- example.collector.yaml. - ZFS Collector config via
collector-zfs.yaml- example.collector-zfs.yaml. See docs/ZFS_POOL_MONITORING.md for setup instructions. - Performance Collector config via
collector-performance.yaml- example.collector-performance.yaml. Falls back tocollector.yamlif not found.
Additional dedicated collectors also have their own config surfaces:
- MDADM collector via
collector-mdadm.yaml- see docs/MDADM_MONITORING.md - Btrfs collector via
collector-btrfs.yaml- see docs/BTRFS_FILESYSTEM_MONITORING.md - Filesystem capacity collector uses its own binary and scheduling env vars - see docs/FILESYSTEM_CAPACITY.md
None of these files are required, however if provided, they allow you to configure how Scrutiny functions.
Cron Schedule
Unfortunately the Cron schedule cannot be configured via the collector.yaml (as the collector binary needs to be triggered by a scheduler/cron).
However, if you are using the official ghcr.io/starosdev/scrutiny:latest-collector, ghcr.io/starosdev/scrutiny:latest-collector-omnibus,
or ghcr.io/starosdev/scrutiny:latest-omnibus docker images,
you can use the COLLECTOR_CRON_SCHEDULE environmental variable to override the default cron schedule (daily @ midnight - 0 0 * * *).
docker run -e COLLECTOR_CRON_SCHEDULE="0 0 * * *" ...
Prometheus Metrics
Scrutiny exposes a Prometheus metrics endpoint at /api/metrics. You can scrape this endpoint to integrate with Grafana or other monitoring tools.
Example Prometheus scrape config:
scrape_configs:
  - job_name: 'scrutiny'
    static_configs:
      - targets: ['scrutiny:8080']
    metrics_path: '/api/metrics'
If you have secured the metrics endpoint with web.metrics.token (see Authentication):
scrape_configs:
  - job_name: 'scrutiny'
    metrics_path: '/api/metrics'
    bearer_token: 'your-metrics-token-here'
    static_configs:
      - targets: ['scrutiny:8080']
Home Assistant Integration (MQTT Discovery)
Scrutiny can natively integrate with Home Assistant via MQTT Discovery. When enabled, each drive automatically appears as a device in Home Assistant with sensors for temperature, health status, power-on hours, power cycle count, and a problem binary sensor.
This is a push-based integration -- state updates are published to MQTT whenever new S.M.A.R.T data is collected, so there's no polling delay. It uses the standard HA MQTT Discovery protocol, so no custom components or HACS add-ons are needed.
Requirements
- An MQTT broker (e.g., Mosquitto, EMQX) accessible from the Scrutiny web server
- Home Assistant with the MQTT integration configured and connected to the same broker
Configuration
Add the following to your scrutiny.yaml (or use environment variables):
web:
  mqtt:
    enabled: true
    broker: "tcp://localhost:1883"
    username: ""
    password: ""
    client_id: "scrutiny"
    topic_prefix: "homeassistant"
Or via environment variables in Docker:
environment:
  SCRUTINY_WEB_MQTT_ENABLED: 'true'
  SCRUTINY_WEB_MQTT_BROKER: 'tcp://mosquitto:1883'
  SCRUTINY_WEB_MQTT_USERNAME: ''
  SCRUTINY_WEB_MQTT_PASSWORD: ''
  SCRUTINY_WEB_MQTT_CLIENT_ID: 'scrutiny'
  SCRUTINY_WEB_MQTT_TOPIC_PREFIX: 'homeassistant'
Entities Per Drive
Each drive is registered as an HA device with the following entities:
| Entity | Type | Device Class | Description |
|---|---|---|---|
| Temperature | sensor |
temperature |
Current drive temperature in Celsius |
| Health Status | sensor |
-- | Passed / Failed (SMART) / Failed (Scrutiny) / Failed (Both) |
| Power On Hours | sensor |
duration |
Total hours the drive has been powered on |
| Power Cycle Count | sensor |
-- | Number of power on/off cycles |
| Drive Problem | binary_sensor |
problem |
ON when the drive has any failure status |
Device Naming
The HA device name follows this priority:
- Custom label (if set via the Scrutiny UI) -- e.g., "Parity Drive"
- Model + device name -- e.g., "ST4000DM000 (sda)"
- Model name only -- e.g., "ST4000DM000"
- Device name only -- e.g., "sda"
- WWN fallback -- e.g., "Drive 0x5000cca264eb01d7"
Changing a device label in Scrutiny immediately updates the device name in Home Assistant.
Behavior
- Startup: On startup, Scrutiny publishes discovery configs and current state for all active (non-archived) devices
- SMART upload: Each time a collector uploads new S.M.A.R.T data, the device state is published to MQTT
- Device registration: New devices are published to HA when first detected by a collector
- Archiving: Archiving a device removes it from HA; unarchiving restores it
- Deletion: Deleting a device removes it from HA
- Availability: Scrutiny publishes an LWT (Last Will and Testament) message so HA marks all entities as unavailable if the Scrutiny server goes offline
Troubleshooting
See docs/TROUBLESHOOTING_NOTIFICATIONS.md for MQTT troubleshooting tips.
Performance Benchmarking
Scrutiny can run periodic fio benchmarks on your drives and track performance over time. This helps detect drive degradation before S.M.A.R.T failures appear -- a drive that is suddenly 50% slower may be failing even if S.M.A.R.T attributes look normal.
What's Measured
| Metric | Description |
|---|---|
| Sequential Read/Write | Throughput in bytes/sec (large block sequential I/O) |
| Random Read/Write IOPS | Input/output operations per second (4K random I/O) |
| Read/Write Latency | Average, P50, P95, P99 latency in nanoseconds |
| Mixed Read/Write IOPS | Combined random read+write performance |
How It Works
- The performance collector (
scrutiny-collector-performance) runs fio benchmarks on configured devices - Results are uploaded to the Scrutiny API and stored as time-series data in InfluxDB
- The web UI displays performance history charts and summary cards on the device detail page
- A baseline is computed from the last 5 results, and current results are compared against it
- Degradation detection flags warnings (>20% throughput drop or >30% latency increase) and failures (>40% / >60%)
Deployment
The performance collector is available as a separate Docker image:
docker run --restart unless-stopped \
  --cap-add SYS_RAWIO \
  --cap-add SYS_ADMIN \
  --device=/dev/sda \
  --device=/dev/sdb \
  -e COLLECTOR_PERF_API_ENDPOINT=http://SCRUTINY_WEB_IPADDRESS:8080 \
  --name scrutiny-perf-collector \
  ghcr.io/starosdev/scrutiny:latest-collector-performance
The collector requires direct device access (not virtualized). Running benchmarks will temporarily increase I/O on the target drives, so schedule accordingly.
Viewing Results
Performance data appears on the device detail page when benchmark results are available. The UI shows:
- Summary cards with latest values and baseline comparison badges
- Throughput chart -- sequential read/write bandwidth over time
- IOPS chart -- random read/write and mixed IOPS over time
- Latency chart -- read latency (average, P95, P99) over time
Use the duration selector to view day, week, month, or year ranges.
Workload Insights
Scrutiny computes drive workload statistics from existing S.M.A.R.T attribute history. No additional collector configuration is required -- once at least two data points exist for a device, workload insights are available.
What's Computed
| Metric | Description |
|---|---|
| Daily Writes / Reads | Average bytes written/read per day over the selected duration |
| R/W Ratio | Ratio of read to write volume (e.g., 2.0:1 means 2x more reads than writes) |
| Intensity | Workload classification: idle, light, medium, or heavy based on total daily I/O |
| SSD Endurance | SMART-reported wear percentage, plus optional rated-TBW usage when configured per device |
| Est. Remaining | Projected remaining lifespan in days/years based on current usage rate |
| Activity Spike | Alert when recent write activity exceeds 3x the baseline average |
Computation Details
- Scrutiny queries cumulative SMART counters (Total LBAs Written/Read for ATA, Data Units Written/Read for NVMe) from InfluxDB
- The delta between the first and last data points in the selected time range is used to compute daily rates
- Intensity is classified by total daily I/O: idle (<1 GB/day), light (1-20 GB), medium (20-100 GB), heavy (>100 GB)
- SSD endurance is estimated from wear-leveling or percentage-used SMART attributes combined with power-on hours
- If a rated TBW value is configured for a device, Scrutiny also shows cumulative TB written versus the configured limit
- Spike detection compares the most recent daily rate against the long-term baseline
Supported Protocols
- ATA: Uses SMART attributes 241/242 (Total LBAs Written/Read) or DeviceStats 1.24/1.40 (Logical Sectors Written/Read)
- NVMe: Uses Data Units Written/Read counters
- SCSI: Limited support (cumulative byte counters are not stored as SMART attributes)
Viewing Workload Data
Navigate to the Workload page from the top navigation bar. Use the duration selector (Day, Week, Month, Year, All) to adjust the analysis window. Click any row to navigate to the device detail page.
Rated TBW Overrides
Some SSDs report misleading wear percentages through SMART. To supplement those values, you can set a per-device rated TBW value from the device detail page. Scrutiny will then show:
- TB written so far
- Rated TBW
- TBW used percentage
This value is user-supplied and does not replace the existing SMART wear indicators.
ATA SMART Self-Test History
Scrutiny now retains ATA SMART self-test log entries that are already present in uploaded smartctl payloads. On ATA drive detail pages, the web UI shows a SMART Self-Tests card with the recorded test type, pass/attention status, controller detail string, and power-on age.
- Data is read from normal SMART uploads; no separate self-test collector is required
- Only ATA devices show this section today
- Scrutiny keeps the most recent 21 recorded entries per physical ATA device identity
- The API route
GET /api/device/{id}/selftestreturns the same history used by the device detail page - This feature records and displays history only; it does not trigger or schedule drive self-tests from the web UI
SMART Attribute Overrides
Scrutiny allows you to customize how individual SMART attributes are evaluated. Use this to suppress false positives, ignore noisy attributes, force specific statuses, or set custom warning/failure thresholds.
From the Device Detail Page (Quick Action)
- Click on a drive to open its detail page
- Find the attribute in the SMART table
- Click the three-dot menu in the Actions column (appears on failed/warning attributes)
- Select Ignore attribute to suppress it, or Force passed to override its status
These quick actions create device-specific overrides. To remove an override, click the purple tune icon and select Remove override.
From Dashboard Settings (Global)
- Open Dashboard Settings (gear icon)
- Expand SMART Attribute Overrides
- Fill in the override form:
- Protocol: ATA, NVMe, or SCSI
- Attribute ID: The attribute identifier (e.g.,
199for UltraDMA CRC Error Count,media_errorsfor NVMe) - Action: Ignore, Force Status, or Custom Threshold
- Device WWN (optional): Leave empty to apply globally, or specify a WWN for a single device
- Click Add Override
From Config File
Add overrides to scrutiny.yaml under smart.attribute_overrides. See example.scrutiny.yaml for examples including ignore, force status, and custom threshold configurations.
Override Types
| Action | Behavior |
|---|---|
| Ignore | Attribute marked as passed; excluded from device failure status and notifications |
| Force Status | Overrides computed status to passed, warn, or failed |
| Custom Threshold | Replaces default thresholds with user-defined warn_above/fail_above values |
Overrides apply at the next SMART data collection. Device status is recalculated immediately when overrides are added or removed via the UI.
Consumer Drive Profiles
Scrutiny can apply vetted ATA consumer drive model or family overrides when evaluating SMART status and computing replacement risk. These profiles are intended to improve interpretation for common SATA HDD and SSD lines using validated thresholds informed by Backblaze failure data.
The feature is enabled by default and can be disabled globally in Dashboard Settings if you prefer generic ATA rules only. On ATA drive detail pages, Scrutiny also shows which evaluation path was used so the replacement-risk output is transparent:
- matched consumer drive profile family
- generic ATA rules because profiles were disabled
- generic ATA rules because no vetted profile matched the drive
For matching behavior, confidence thresholds, and API fields such as consumer_drive_profiles_enabled and consumer_drive_profile_family, see docs/CONSUMER_DRIVE_PROFILES.md.
Notifications
Scrutiny supports multiple notification target types:
- Shoutrrr targets using the existing
discord://,smtp://,telegram://,gotify://, and similar URL formats - Apprise targets using an explicit
apprise+prefix, for exampleapprise+mailto://...,apprise+gotify://..., orapprise+https://discord.com/api/webhooks/... - Custom
script://targets that execute a local script with notification metadata in environment variables - Raw
http://andhttps://webhook targets
This keeps existing Shoutrrr configuration backward compatible while adding Apprise as a second notification engine. If you want Scrutiny to route a target through Apprise, the apprise+ prefix is required.
Common examples:
discord://token@webhookidgotify://gotify-host/tokenscript:///file/path/on/diskhttps://www.example.com/pathapprise+mailto://example.com?user=alerts@example.com&pass=app-password&to=admin@example.comapprise+gotify://gotify-host/tokenapprise+tgram://123456789:ABCDEF/123456789/
Check the notify.urls section of example.scrutiny.yaml for more examples.
For more information and troubleshooting, see the TROUBLESHOOTING_NOTIFICATIONS.md file
Heartbeat Notifications
Scrutiny can send periodic "all clear" heartbeat notifications to confirm the monitoring system is running and all drives are healthy. This is useful for integration with uptime monitoring tools like Uptime Kuma. When delivered through SMTP or HTML-capable Apprise targets, heartbeat messages use the same HTML-plus-plain-text pattern as the other email notifications.
- Disabled by default -- enable via Settings in the web UI or the
/api/settingsAPI - Configurable interval -- defaults to every 24 hours
- Suppressed during failures -- heartbeat is not sent if any drive has active failures (failure notifications take priority)
Per-Device Notification Control
You can mute notifications for specific devices through the web UI. This is useful for drives that are known to have issues but are being monitored before replacement.
Scheduled Reports [WIP]
Scrutiny can generate and email periodic health reports summarizing device status, temperature, alerts, and ZFS pool health. Reports are sent via your configured notification URLs. SMTP deliveries use multipart email with separate HTML and plain-text bodies. HTML-capable Apprise targets receive the HTML body when supported by the destination, while plain-text-only targets receive the text body.
Note: This feature is a work in progress. It is functional and tested, but the UI and report content may change based on feedback. We'd appreciate hearing about your experience -- please open an issue with suggestions or bug reports.
Configuration is done via the Settings page in the web UI, or via the /api/settings API:
| Setting | Key | Default | Description |
|---|---|---|---|
| Enable reports | metrics.report_enabled |
false |
Master toggle for scheduled reports |
| Daily reports | metrics.report_daily_enabled |
false |
Enable daily report |
| Daily time | metrics.report_daily_time |
"03:00" |
Time to send daily report (24h format) |
| Weekly reports | metrics.report_weekly_enabled |
false |
Enable weekly report |
| Weekly day | metrics.report_weekly_day |
1 |
Day of week (0=Sunday, 1=Monday, ..., 6=Saturday) |
| Weekly time | metrics.report_weekly_time |
"03:00" |
Time to send weekly report |
| Monthly reports | metrics.report_monthly_enabled |
false |
Enable monthly report |
| Monthly day | metrics.report_monthly_day |
1 |
Day of month (1-28) |
| Monthly time | metrics.report_monthly_time |
"03:00" |
Time to send monthly report |
| PDF export | metrics.report_pdf_enabled |
false |
Also save reports as PDF files |
| PDF path | metrics.report_pdf_path |
"/opt/scrutiny/reports" |
Directory for PDF files |
Example API call to enable daily reports:
curl -X POST http://localhost:8080/api/settings \
  -H "Content-Type: application/json" \
  -d '{"metrics": {"report_enabled": true, "report_daily_enabled": true, "report_daily_time": "07:00"}}'
On-demand report generation:
# Generate and send a report immediately
curl 'http://localhost:8080/api/reports/generate?period=daily&test=true'

# Generate a PDF report
curl 'http://localhost:8080/api/reports/generate?period=daily&format=pdf'
Report content includes:
- Overall health status (passed/warning/failed) with color-coded banner
- Summary counts (total, passed, warning, failed devices)
- Failure and warning details per device
- Device table with status, temperature, power-on hours, and alert counts
- Temperature summary (hottest/coldest devices)
- ZFS pool health (if applicable)
Missed Ping Digest
When multiple collectors miss their expected check-in within the configured timeout, Scrutiny sends a single consolidated notification listing all affected devices, instead of flooding your inbox with one email per device.
Testing Notifications
You can test that your notifications are configured correctly by posting an empty payload to the notifications health check API.
curl -X POST http://localhost:8080/api/health/notify
The test route sends through the same configured targets as normal notifications, including Shoutrrr, explicit apprise+... targets, scripts, and raw webhooks.
Debug mode & Log Files
Scrutiny provides various methods to change the log level and generate log files. The web server and collector have independent log configurations and can be set separately.
Shared Startup Banner Suppression
Set SCRUTINY_NO_LOGO=true to suppress the ASCII startup banner in the web binary and all container-facing collector binaries.
By default, the banner is still printed during startup. This env var is evaluated at process startup, so it works alongside SCRUTINY_LOG_LEVEL and COLLECTOR_LOG_LEVEL when you want quiet WARN or ERROR startup behavior without changing the default banner behavior for other runs.
Valid Log Levels
The following log levels are supported (case-insensitive), listed from highest to lowest severity:
| Level | Description |
|---|---|
PANIC |
Calls panic after logging |
FATAL |
Calls os.Exit(1) after logging |
ERROR |
Error conditions |
WARN |
Warning conditions (also accepts WARNING) |
INFO |
General operational messages (default) |
DEBUG |
Verbose diagnostic information |
TRACE |
Very fine-grained diagnostic information |
Setting a level includes all messages at that level and above (higher severity).
For example, setting WARN will show WARN, ERROR, FATAL, and PANIC messages, but not INFO, DEBUG, or TRACE.
Web Server/API
You can use environmental variables to enable debug logging and/or log files for the web server:
DEBUG=true
SCRUTINY_NO_LOGO=true
SCRUTINY_LOG_FILE=/tmp/web.log
You can configure the log level and log file in the config file:
log:
  file: '/tmp/web.log'
  level: DEBUG
Or if you're not using docker, you can pass CLI arguments to the web server during startup:
scrutiny start --debug --log-file /tmp/web.log
Web Server Environment Variable Overrides
Any web server configuration key can be overridden via environment variables using the SCRUTINY_ prefix.
Dots and dashes in key names become underscores.
| Config Key | Environment Variable | Default Value |
|---|---|---|
web.listen.port |
SCRUTINY_WEB_LISTEN_PORT |
8080 |
web.listen.host |
SCRUTINY_WEB_LISTEN_HOST |
0.0.0.0 |
web.listen.basepath |
SCRUTINY_WEB_LISTEN_BASEPATH |
`` |
web.listen.read_timeout_seconds |
SCRUTINY_WEB_LISTEN_READ_TIMEOUT_SECONDS |
10 |
web.listen.write_timeout_seconds |
SCRUTINY_WEB_LISTEN_WRITE_TIMEOUT_SECONDS |
30 |
web.listen.idle_timeout_seconds |
SCRUTINY_WEB_LISTEN_IDLE_TIMEOUT_SECONDS |
60 |
web.database.location |
SCRUTINY_WEB_DATABASE_LOCATION |
/opt/scrutiny/config/scrutiny.db |
web.database.journal_mode |
SCRUTINY_WEB_DATABASE_JOURNAL_MODE |
WAL |
web.src.frontend.path |
SCRUTINY_WEB_SRC_FRONTEND_PATH |
/opt/scrutiny/web |
web.influxdb.scheme |
SCRUTINY_WEB_INFLUXDB_SCHEME |
http |
web.influxdb.host |
SCRUTINY_WEB_INFLUXDB_HOST |
localhost |
web.influxdb.port |
SCRUTINY_WEB_INFLUXDB_PORT |
8086 |
web.influxdb.org |
SCRUTINY_WEB_INFLUXDB_ORG |
scrutiny |
web.influxdb.bucket |
SCRUTINY_WEB_INFLUXDB_BUCKET |
metrics |
web.influxdb.token |
SCRUTINY_WEB_INFLUXDB_TOKEN |
scrutiny-default-admin-token |
web.influxdb.init_username |
SCRUTINY_WEB_INFLUXDB_INIT_USERNAME |
admin |
web.influxdb.init_password |
SCRUTINY_WEB_INFLUXDB_INIT_PASSWORD |
password12345 |
web.influxdb.tls.insecure_skip_verify |
SCRUTINY_WEB_INFLUXDB_TLS_INSECURE_SKIP_VERIFY |
false |
web.influxdb.retention_policy |
SCRUTINY_WEB_INFLUXDB_RETENTION_POLICY |
true |
web.influxdb.retention.daily |
SCRUTINY_WEB_INFLUXDB_RETENTION_DAILY |
1296000 (15 days) |
web.influxdb.retention.weekly |
SCRUTINY_WEB_INFLUXDB_RETENTION_WEEKLY |
5443200 (9 weeks) |
web.influxdb.retention.monthly |
SCRUTINY_WEB_INFLUXDB_RETENTION_MONTHLY |
65318400 (25 months) |
web.metrics.enabled |
SCRUTINY_WEB_METRICS_ENABLED |
true |
web.metrics.token |
SCRUTINY_WEB_METRICS_TOKEN |
`` |
web.uptime_kuma.insecure_skip_verify |
SCRUTINY_WEB_UPTIME_KUMA_INSECURE_SKIP_VERIFY |
false |
web.auth.enabled |
SCRUTINY_WEB_AUTH_ENABLED |
false |
web.auth.token |
SCRUTINY_WEB_AUTH_TOKEN |
`` |
web.auth.jwt_secret |
SCRUTINY_WEB_AUTH_JWT_SECRET |
`` |
web.auth.jwt_expiry_hours |
SCRUTINY_WEB_AUTH_JWT_EXPIRY_HOURS |
24 |
web.auth.admin_username |
SCRUTINY_WEB_AUTH_ADMIN_USERNAME |
admin |
web.auth.admin_password |
SCRUTINY_WEB_AUTH_ADMIN_PASSWORD |
`` |
web.docs.public |
SCRUTINY_WEB_DOCS_PUBLIC |
false |
web.mqtt.enabled |
SCRUTINY_WEB_MQTT_ENABLED |
false |
web.mqtt.broker |
SCRUTINY_WEB_MQTT_BROKER |
tcp://localhost:1883 |
web.mqtt.username |
SCRUTINY_WEB_MQTT_USERNAME |
`` |
web.mqtt.password |
SCRUTINY_WEB_MQTT_PASSWORD |
`` |
web.mqtt.client_id |
SCRUTINY_WEB_MQTT_CLIENT_ID |
scrutiny |
web.mqtt.topic_prefix |
SCRUTINY_WEB_MQTT_TOPIC_PREFIX |
homeassistant |
web.mqtt.qos |
SCRUTINY_WEB_MQTT_QOS |
1 |
web.mqtt.retain |
SCRUTINY_WEB_MQTT_RETAIN |
true |
log.level |
SCRUTINY_LOG_LEVEL |
INFO |
log.file |
SCRUTINY_LOG_FILE |
`` |
notify.urls |
SCRUTINY_NOTIFY_URLS |
`` |
failures.transient.ata |
SCRUTINY_FAILURES_TRANSIENT_ATA |
[195] |
failures.ignored.ata |
SCRUTINY_FAILURES_IGNORED_ATA |
[] |
failures.ignored.devstat |
SCRUTINY_FAILURES_IGNORED_DEVSTAT |
[] |
failures.ignored.nvme |
SCRUTINY_FAILURES_IGNORED_NVME |
[] |
failures.ignored.scsi |
SCRUTINY_FAILURES_IGNORED_SCSI |
[] |
Environment variables take precedence over config file values. This is useful for containerized deployments where you want to override specific settings without modifying the config file.
Example:
docker run -e SCRUTINY_WEB_LISTEN_PORT=9090 \
  -e SCRUTINY_WEB_INFLUXDB_HOST=influxdb.local \
  -e SCRUTINY_NO_LOGO=true \
  -e SCRUTINY_LOG_LEVEL=DEBUG \
  ghcr.io/starosdev/scrutiny:latest-web
Collector
You can use environmental variables to enable debug logging and/or log files for the collector:
DEBUG=true
SCRUTINY_NO_LOGO=true
COLLECTOR_LOG_FILE=/tmp/collector.log
Or if you're not using docker, you can pass CLI arguments to the collector during startup:
scrutiny-collector-metrics run --debug --log-file /tmp/collector.log
Collector Environment Variable Overrides
Any collector configuration key can be overridden via environment variables using the COLLECTOR_ prefix.
Dots and dashes in key names become underscores.
| Config Key | Environment Variable | Default Value |
|---|---|---|
host.id |
COLLECTOR_HOST_ID |
`` |
api.endpoint |
COLLECTOR_API_ENDPOINT |
http://localhost:8080 |
api.timeout |
COLLECTOR_API_TIMEOUT |
60 |
api.token |
COLLECTOR_API_TOKEN |
`` |
commands.metrics_smartctl_bin |
COLLECTOR_COMMANDS_METRICS_SMARTCTL_BIN |
smartctl |
commands.metrics_scan_args |
COLLECTOR_COMMANDS_METRICS_SCAN_ARGS |
--scan --json |
commands.metrics_info_args |
COLLECTOR_COMMANDS_METRICS_INFO_ARGS |
--info --json |
commands.metrics_smart_args |
COLLECTOR_COMMANDS_METRICS_SMART_ARGS |
--xall --json |
commands.metrics_smartctl_wait |
COLLECTOR_COMMANDS_METRICS_SMARTCTL_WAIT |
0 |
allow_listed_devices |
COLLECTOR_ALLOW_LISTED_DEVICES |
[] |
log.level |
COLLECTOR_LOG_LEVEL |
INFO |
log.file |
COLLECTOR_LOG_FILE |
`` |
Environment variables take precedence over config file values. This is useful for containerized deployments where you want to override specific settings without modifying the config file.
Example:
docker run -e COLLECTOR_COMMANDS_METRICS_SMART_ARGS="--xall --json -T permissive" \
  -e COLLECTOR_API_ENDPOINT=http://scrutiny-web:8080 \
  -e SCRUTINY_NO_LOGO=true \
  ghcr.io/starosdev/scrutiny:latest-collector
Docker-Only Environment Variables
These environment variables are only available when running the collector in Docker containers (handled by the entrypoint script, not Viper configuration):
| Environment Variable | Default Value | Description |
|---|---|---|
COLLECTOR_CRON_SCHEDULE |
0 0 * * * |
Cron schedule for SMART data collection |
COLLECTOR_RUN_STARTUP |
false |
Run collector immediately on container start |
COLLECTOR_RUN_STARTUP_SLEEP |
1 |
Delay in seconds before startup collection |
Performance Collector
The performance collector is a separate binary (scrutiny-collector-performance) that runs fio benchmarks. It can use its own config file (collector-performance.yaml) or fall back to the main collector.yaml.
DEBUG=true
SCRUTINY_NO_LOGO=true
COLLECTOR_PERF_LOG_FILE=/tmp/performance.log
Or via CLI:
scrutiny-collector-performance run --debug --log-file /tmp/performance.log --profile quick
Performance Collector Environment Variable Overrides
The performance collector checks COLLECTOR_PERF_ prefixed variables first, then falls back to COLLECTOR_ prefixed variables.
| Config Key | Environment Variable | Default Value |
|---|---|---|
host.id |
COLLECTOR_PERF_HOST_ID or COLLECTOR_HOST_ID |
`` |
api.endpoint |
COLLECTOR_PERF_API_ENDPOINT or COLLECTOR_API_ENDPOINT |
http://localhost:8080 |
performance.profile |
COLLECTOR_PERF_PROFILE |
quick |
performance.enabled |
COLLECTOR_PERFORMANCE_ENABLED |
false |
performance.allow_direct_device_io |
COLLECTOR_PERFORMANCE_ALLOW_DIRECT_DEVICE_IO |
false |
performance.temp_file_size |
COLLECTOR_PERFORMANCE_TEMP_FILE_SIZE |
256M |
commands.performance_fio_bin |
COLLECTOR_COMMANDS_PERFORMANCE_FIO_BIN |
fio |
log.level |
COLLECTOR_LOG_LEVEL |
INFO |
log.file |
COLLECTOR_PERF_LOG_FILE or COLLECTOR_LOG_FILE |
`` |
Performance Collector Docker-Only Environment Variables
| Environment Variable | Default Value | Description |
|---|---|---|
COLLECTOR_PERF_CRON_SCHEDULE |
0 2 * * 0 |
Cron schedule (default: Sunday 2 AM) |
COLLECTOR_PERF_RUN_STARTUP |
false |
Run benchmark immediately on container start |
COLLECTOR_PERF_RUN_STARTUP_SLEEP |
1 |
Delay in seconds before startup run |
Example:
docker run --restart unless-stopped \
  --cap-add SYS_RAWIO \
  --cap-add SYS_ADMIN \
  --device=/dev/sda \
  --device=/dev/sdb \
  -e COLLECTOR_PERF_API_ENDPOINT=http://scrutiny-web:8080 \
  -e COLLECTOR_PERF_PROFILE=quick \
  -e COLLECTOR_PERF_CRON_SCHEDULE="0 2 * * 0" \
  ghcr.io/starosdev/scrutiny:latest-collector-performance
MDADM Collector
MDADM RAID monitoring is handled by a separate binary, scrutiny-collector-mdadm. It is not part of the SMART metrics collector or the fio performance collector.
The MDADM collector prefers its own config file, collector-mdadm.yaml, and falls back to collector.yaml if that file is not present.
MDADM Collector Environment Variable Overrides
| Setting | Preferred Environment Variable | Fallback |
|---|---|---|
| API endpoint | COLLECTOR_MDADM_API_ENDPOINT |
COLLECTOR_API_ENDPOINT |
| API token | COLLECTOR_MDADM_API_TOKEN |
COLLECTOR_API_TOKEN |
| Log file | COLLECTOR_MDADM_LOG_FILE |
COLLECTOR_LOG_FILE |
| Debug logging | COLLECTOR_MDADM_DEBUG |
COLLECTOR_DEBUG or DEBUG |
MDADM Collector Docker-Only Scheduling Variables
| Environment Variable | Default Value | Description |
|---|---|---|
COLLECTOR_MDADM_CRON_SCHEDULE |
*/15 * * * * |
Cron schedule for MDADM collection |
COLLECTOR_MDADM_RUN_STARTUP |
false |
Run collection immediately on container start |
COLLECTOR_MDADM_RUN_STARTUP_SLEEP |
1 |
Delay in seconds before the startup run |
For mounts, capabilities, compose examples, and troubleshooting, see docs/MDADM_MONITORING.md.
If you upgrade from a build that registered MDADM arrays before host_id was persisted on re-registration, run one fresh MDADM collection on each affected host so grouped host headings can backfill correctly in the UI.
Supported Architectures
| Architecture Name | Binaries | Docker |
|---|---|---|
| linux-amd64 | :white_check_mark: | :white_check_mark: |
| linux-arm-5 | :white_check_mark: | |
| linux-arm-6 | :white_check_mark: | |
| linux-arm-7 | :white_check_mark: | web/collector only |
| linux-arm64 | :white_check_mark: | :white_check_mark: |
| freebsd-amd64 | :white_check_mark: | |
| macos-amd64 | :white_check_mark: | |
| macos-arm64 | :white_check_mark: | |
| windows-amd64 | :white_check_mark: | WIP |
| windows-arm64 | :white_check_mark: |
Contributing
Please see the CONTRIBUTING.md for instructions for how to develop and contribute to the scrutiny codebase.
Work your magic and then submit a pull request. We love pull requests!
If you find the documentation lacking, help us out and update this README.md. If you don't have the time to work on Scrutiny, but found something we should know about, please submit an issue.
Versioning
We use SemVer for versioning. For the versions available, see the tags on this repository.
Credits
Original Author: Jason Kulatunga (@AnalogJ) -- Created Scrutiny and built the foundation this fork builds upon.
Fork Maintainer: @Starosdev -- Maintaining this fork with continued development and community contributions.
License
- MIT
- Logo: Glasses by matias porta lezcano
Install scrutiny-collector-performance on Unraid in a few clicks.
Find scrutiny-collector-performance in Community Apps on your Unraid server, review the template, and click Install. Unraid handles the Docker app or plugin setup from the published template.
Categories
Related apps
Explore more like this
Explore allDetails
ghcr.io/starosdev/scrutiny:latest-collector-performanceRuntime arguments
- Network
bridge- Shell
bash- Privileged
- false
- Extra Params
--cap-add SYS_RAWIO --cap-add SYS_ADMIN
Template configuration
Required for device detection. Do not change.
- Target
- /run/udev
- Default
- /run/udev
First disk to benchmark. Add more Device entries for additional disks. For NVMe, pass both /dev/nvme0 (controller) and /dev/nvme0n1 (namespace).
- Default
- /dev/sda
Scrutiny web server URL (e.g. http://scrutiny-web:8080). Required.
- Target
- COLLECTOR_PERF_API_ENDPOINT
Unique identifier for this collector host.
- Target
- COLLECTOR_PERF_HOST_ID
Performance benchmark schedule (cron format). Default: Sunday at 2 AM.
- Target
- COLLECTOR_PERF_CRON_SCHEDULE
- Default
- 0 2 * * 0
Run performance benchmarks immediately on container startup.
- Target
- COLLECTOR_PERF_RUN_STARTUP
- Default
- false
Benchmark profile: 'quick' (~60s per device) or 'comprehensive' (~300s per device).
- Target
- COLLECTOR_PERF_PROFILE
- Default
- quick