
All apps · 0 apps

pve-metrics-exporter
Docker app from drumandbytes' Repository
Overview
Readme
View on GitHubpve-metrics-exporter
A small Proxmox VE exporter with two outputs from one shared data fetch.
It provides:
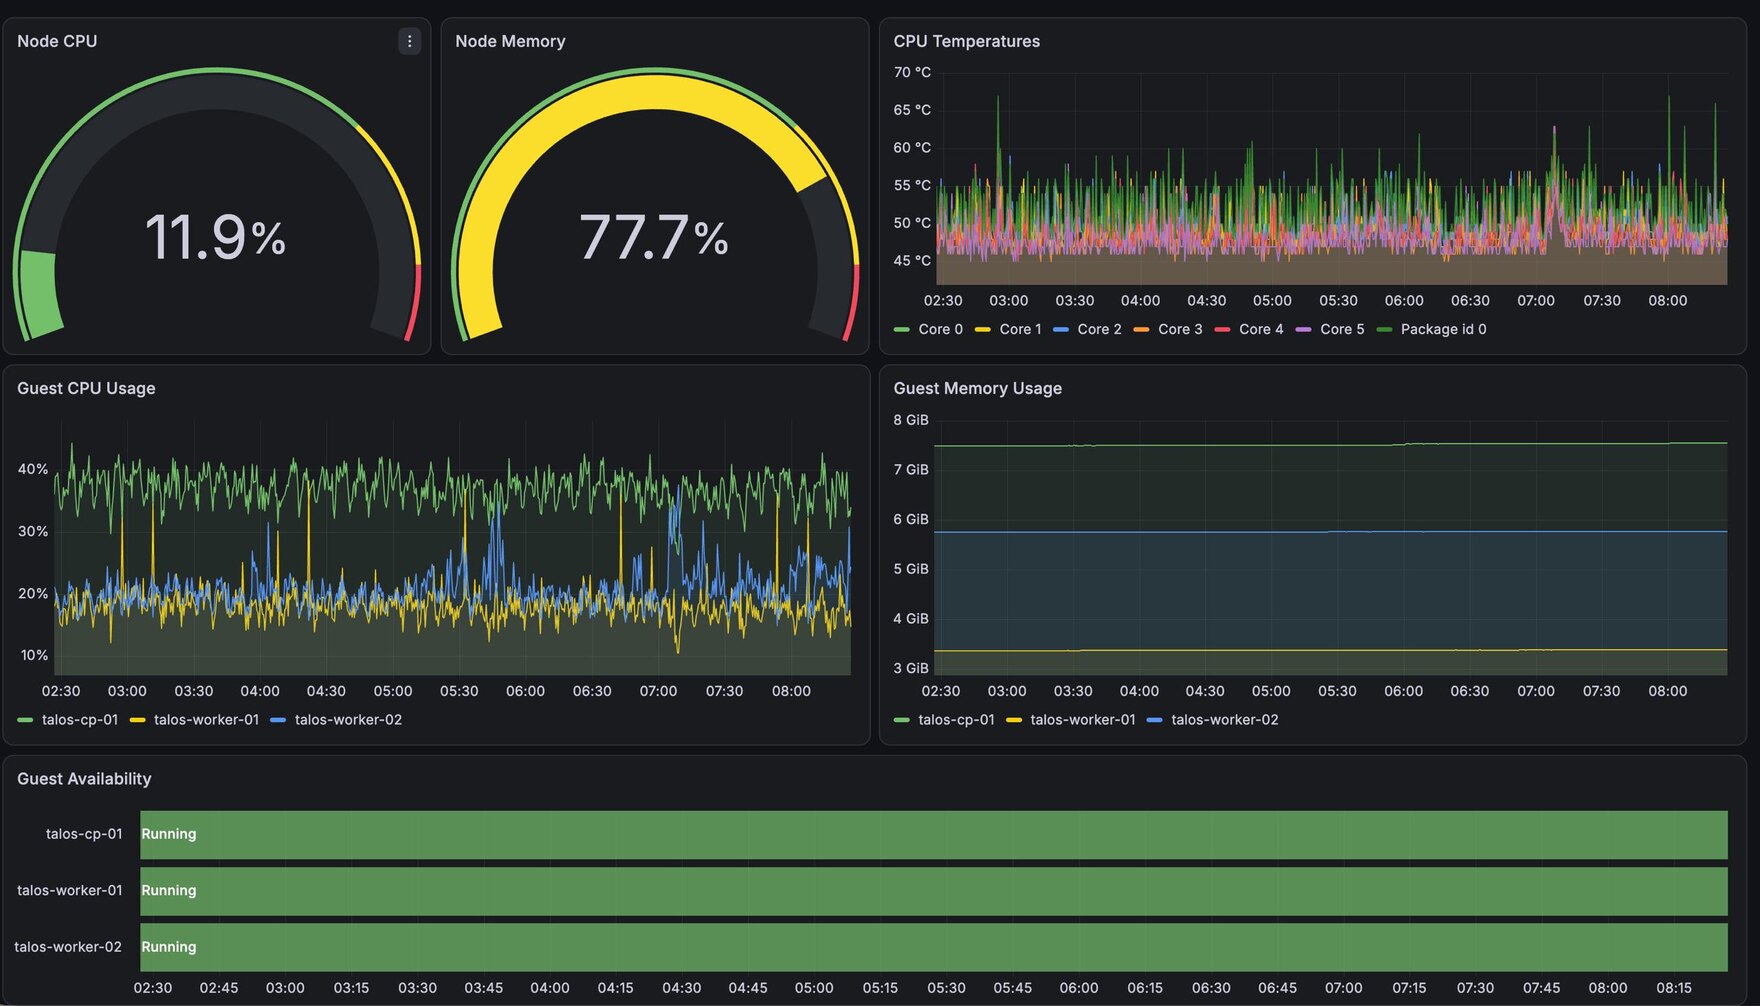
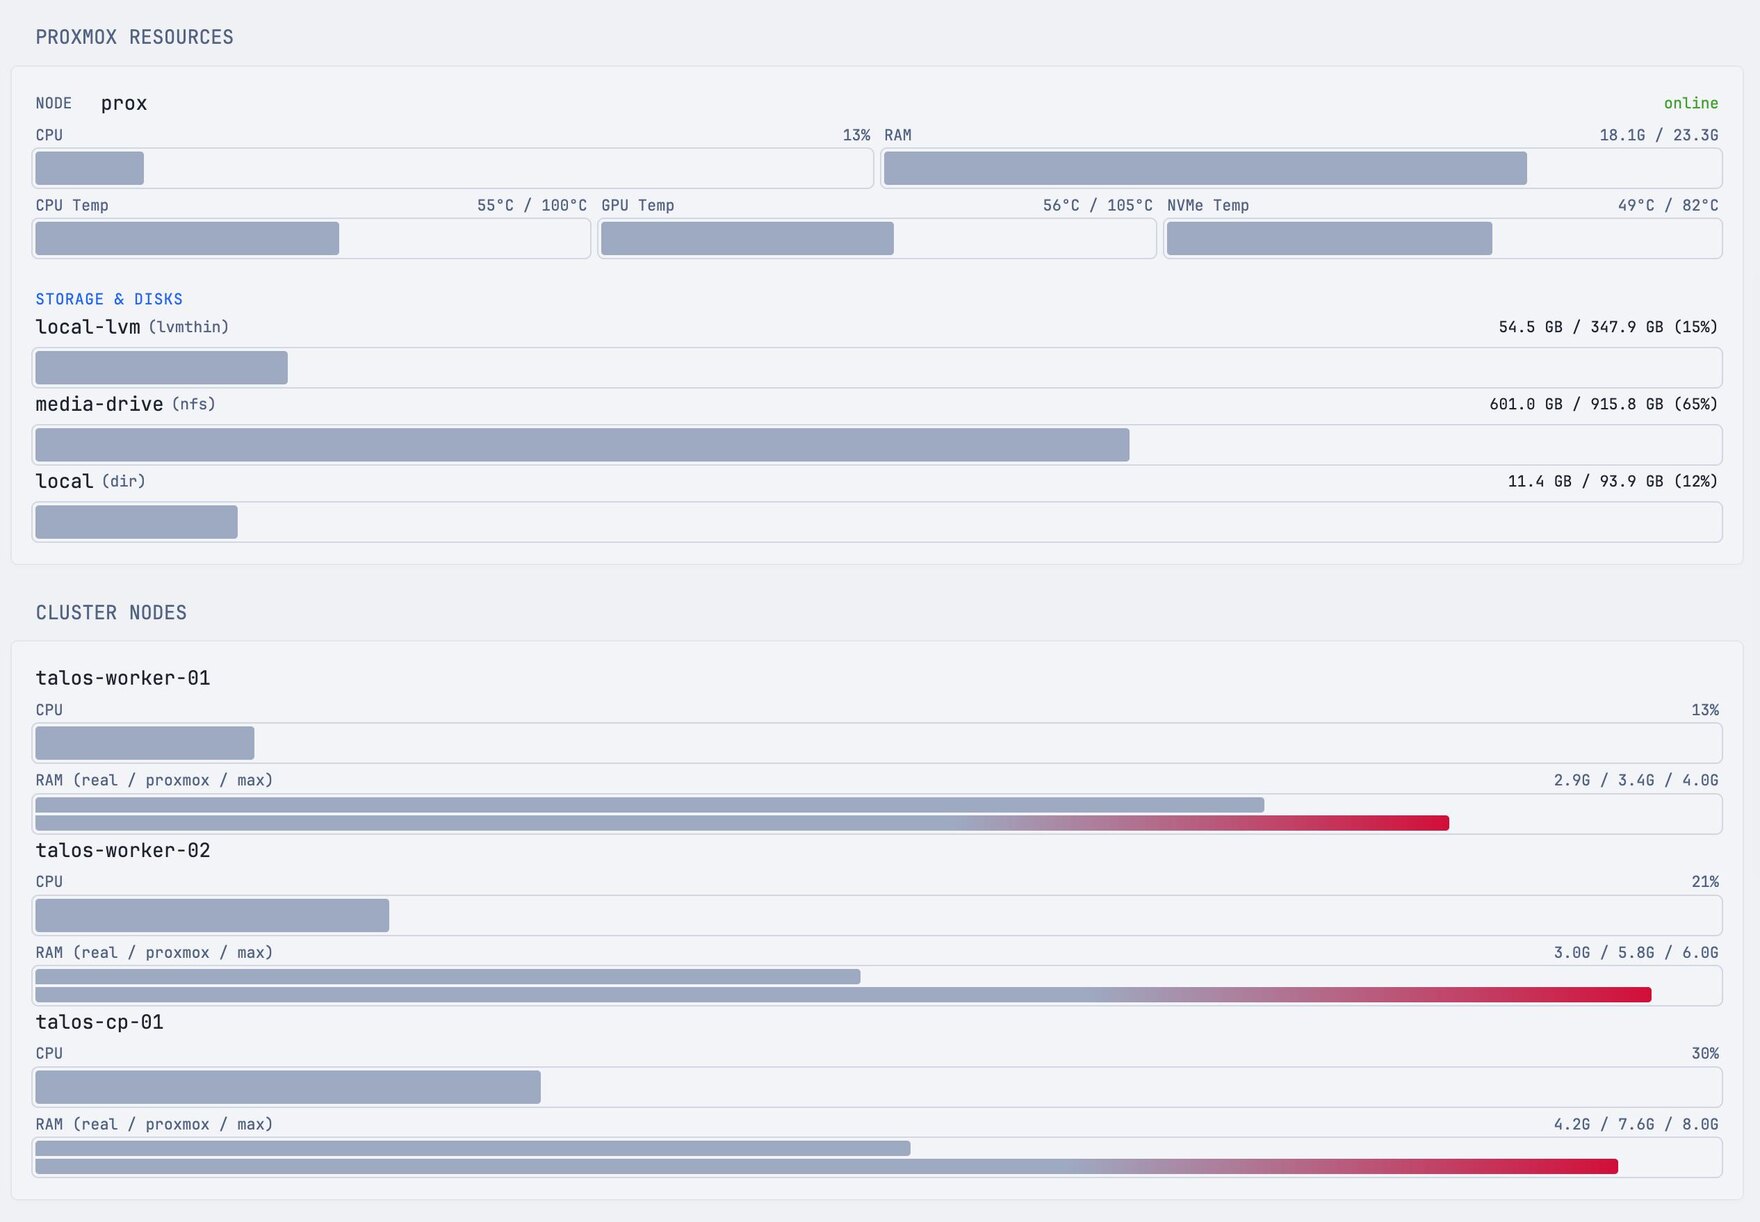
/metrics— a real Prometheus exporter (viaclient_golang), covering node/VM/LXC/storage resource usage and hardware sensor temperatures (CPU, GPU, NVMe, chipset, etc. — whateverlm-sensorsreports on the host). Most Proxmox exporters skip temperatures entirely; this one doesn't./api/summary— the same data as flat, pre-computed JSON (percentages already done, sensor labels already parsed), meant for dashboards like Glance that want to render values directly without embedding data-munging logic in a template.
Both are served from one shared, short-TTL cache, so polling both concurrently doesn't double the load on your Proxmox API.
Dashboards
/metrics in Grafana (left); /api/summary rendered directly by Glance (right):
Why
Proxmox's sensorsOutput field (from /nodes/{node}/status) embeds the raw sensors -j (lm-sensors) output as a JSON-encoded string, not a nested object — most tools that consume the Proxmox API skip it because of that extra parsing step. This exporter does the parsing once, server-side, and exposes clean values either way you want them.
Running it
docker run -d \
  -p 9221:9221 \
  -e PROXMOX_URL=https://your-proxmox-host:8006 \
  -e PROXMOX_TOKEN='PVEAPIToken=user@pve!tokenid=uuid' \
  ghcr.io/drumandbytes/pve-metrics-exporter:latest
Then:
curl http://localhost:9221/api/summary
curl http://localhost:9221/metrics
Proxmox API token
Create one in the Proxmox web UI under Datacenter → Permissions → API Tokens. The token needs read access to /, /nodes, and whatever storage/VM paths you want reflected (PVEAuditor role is enough — this exporter never writes anything). Uncheck "Privilege Separation" only if you want the token to inherit the user's full permissions instead of managing them separately.
PROXMOX_TOKEN is the full Authorization header value, e.g. PVEAPIToken=user@pve!tokenid=uuid-secret-here.
Configuration
All configuration is via environment variables:
| Variable | Default | Description |
|---|---|---|
PROXMOX_URL |
(required) | Base URL of the Proxmox API, e.g. https://192.168.1.10:8006 |
PROXMOX_TOKEN |
(required) | Full Authorization header value (see above) |
PROXMOX_INSECURE_SKIP_VERIFY |
true |
Skip TLS certificate verification. Proxmox ships a self-signed cert by default; set to false once you've replaced it with one from a trusted CA. |
PROXMOX_REQUEST_TIMEOUT |
10s |
Timeout for each request to the Proxmox API |
LISTEN_ADDR |
:9221 |
Address/port the exporter listens on |
CACHE_TTL |
15s |
How long a fetched result is reused before hitting the Proxmox API again |
CACHE_MAX_STALE |
5m |
If a refresh fails, how long a previously-cached result keeps being served before the error is surfaced instead |
TEMPERATURE_UNIT |
celsius |
celsius or fahrenheit — affects /api/summary only. See below. |
Why isn't TEMPERATURE_UNIT global?
Prometheus convention bakes the unit into the metric name itself (see node_exporter's node_hwmon_temp_celsius), specifically so a dashboard or alert built against that name never has to guess what unit it holds. Toggling it via an env var would mean either lying about the metric's name or renaming it out from under someone's saved panel the moment they flip the setting. So /metrics always exposes both pve_node_temperature_celsius and pve_node_temperature_fahrenheit, unconditionally, side by side — nothing to configure, nothing that can break. TEMPERATURE_UNIT only affects the convenience fields in /api/summary's JSON, which is meant for direct human-facing display (e.g. a Glance widget), where a single configured unit is exactly what you want.
/api/summary response shape
{
  "generated_at": "2026-08-29T10:48:53Z",
  "temperature_unit": "celsius",
  "nodes": [
    {
      "name": "prox",
      "status": "online",
      "cpu_percent": 12.6,
      "mem_used_bytes": 18397749248,
      "mem_total_bytes": 25064054784,
      "mem_percent": 73.4,
      "disk_used_bytes": 12235657216,
      "disk_total_bytes": 100861726720,
      "disk_percent": 12.1,
      "temperatures": [
        { "kind": "cpu", "chip": "coretemp-isa-0000", "label": "Package id 0", "value": 50, "critical": 100, "critical_percent": 50 }
      ],
      "cpu_temp": { "kind": "cpu", "chip": "coretemp-isa-0000", "label": "Package id 0", "value": 50, "critical": 100, "critical_percent": 50 },
      "gpu_temp": { "kind": "gpu", "chip": "nouveau-pci-0100", "label": "temp1", "value": 55, "critical": 105, "critical_percent": 52.4 },
      "nvme_temp": { "kind": "nvme", "chip": "nvme-pci-0200", "label": "Composite", "value": 48.85, "critical": 81.85, "critical_percent": 59.7 }
    }
  ],
  "vms": [ { "type": "qemu", "node": "prox", "name": "...", "vmid": 100, "status": "running", "cpu_percent": 14, "mem_used_bytes": 0, "mem_total_bytes": 0, "mem_percent": 0 } ],
  "lxcs": [],
  "storages": [ { "node": "prox", "name": "local-lvm", "plugin_type": "lvmthin", "used_bytes": 0, "total_bytes": 0, "percent": 12.3 } ]
}
cpu_temp/gpu_temp/nvme_temp are best-effort convenience picks out of temperatures (the full list is always included too) — the same object shape either way. They're null when nothing matching was found — e.g. a node with no lm-sensors configured, or no discrete GPU.
critical/critical_percent are omitted (not present, not null) when the sensor chip doesn't report a usable threshold at all — an ACPI thermal zone typically has neither _crit nor _max. A sentinel-like implausible value some NVMe firmwares report for an unimplemented threshold (seen in the wild: 65261.85) is also rejected rather than surfaced as if it meant something. critical_percent is always computed from the raw Celsius reading regardless of temperature_unit — Celsius and Fahrenheit don't share a zero point, so a ratio computed after converting to Fahrenheit would not match the same ratio in Celsius.
/metrics
Standard Prometheus text exposition format. Key metrics:
pve_up— whether the last fetch from Proxmox succeededpve_node_cpu_percent,pve_node_memory_{used,total}_bytes,pve_node_disk_{used,total}_bytespve_node_temperature_celsius/pve_node_temperature_fahrenheit— labeled bynode,kind(cpu/gpu/nvme/drive/chipset/acpi/other),chip,labelpve_node_temperature_critical_celsius/pve_node_temperature_critical_fahrenheit— same labels; only present for readings whose chip reports a crit/max threshold (missing series for the rest is normal, not a bug)pve_guest_up,pve_guest_cpu_percent,pve_guest_memory_{used,total}_bytes— labeled bytype(qemu/lxc),node,name,vmidpve_storage_{used,total}_bytes— labeled bynode,storage,plugin
Alerting
alerts/pve-metrics-exporter.rules.yml has ready-made Prometheus alerting rules. Add it under rule_files:, or paste its group into a PrometheusRule's spec.groups on kube-prometheus-stack.
| Alert | Fires when | Severity |
|---|---|---|
ProxmoxExporterStale |
the exporter can't reach the Proxmox API (serving a cached result) for 5m | warning |
ProxmoxTemperatureHigh |
a sensor is within 10°C of its own critical temperature for 10m | warning |
ProxmoxTemperatureCritical |
a sensor is at or above its critical temperature for 2m | critical |
ProxmoxNodeCpuHigh |
node CPU above 90% for 30m | warning |
ProxmoxNodeMemoryHigh |
node memory above 95% for 30m | warning |
ProxmoxNodeRootDiskFilling |
node root filesystem above 90% for 1h | warning |
ProxmoxStorageFilling / ProxmoxStorageFull |
a storage above 85% for 1h / 95% for 15m | warning / critical |
ProxmoxGuestStopped |
a VM or container that was running an hour ago is stopped | warning |
Temperature alerts only cover sensors that report a critical threshold, so a hot sensor with no known limit won't page. The thresholds are starting points. Every rule has unit tests in alerts/pve-metrics-exporter.test.yml, run in CI with promtool test rules.
Using it with Glance
- type: custom-api
  title: Proxmox
  cache: 30s
  url: http://pve-metrics-exporter.your-namespace.svc.cluster.local:9221/api/summary
  template: |
    {{ range .JSON.Array "nodes" }}
    <div>{{ .String "name" }}: {{ .Float "cpu_percent" | printf "%.0f" }}% CPU, {{ .Float "cpu_temp.value" | printf "%.0f" }}°C</div>
    {{ end }}
Kubernetes
A minimal Deployment + Service:
apiVersion: apps/v1
kind: Deployment
metadata:
  name: pve-metrics-exporter
spec:
  replicas: 1
  selector:
    matchLabels: { app: pve-metrics-exporter }
  template:
    metadata:
      labels: { app: pve-metrics-exporter }
    spec:
      containers:
        - name: pve-metrics-exporter
          image: ghcr.io/drumandbytes/pve-metrics-exporter:1.0.0
          ports:
            - containerPort: 9221
          env:
            - name: PROXMOX_URL
              value: https://your-proxmox-host:8006
            - name: PROXMOX_TOKEN
              valueFrom:
                secretKeyRef: { name: pve-metrics-exporter-secret, key: PROXMOX_TOKEN }
          resources:
            requests: { memory: 32Mi, cpu: 10m }
            limits: { memory: 64Mi }
---
apiVersion: v1
kind: Service
metadata:
  name: pve-metrics-exporter
spec:
  selector: { app: pve-metrics-exporter }
  ports:
    - port: 9221
Add a ServiceMonitor (kube-prometheus-stack) or a plain scrape config pointed at port 9221 to pull it into Prometheus.
Building locally
go build ./...
go vet ./...
docker build -t pve-metrics-exporter .
Verifying the image
Every published image carries a signed SLSA build provenance attestation (generated by GitHub Actions, stored alongside the image in GHCR):
gh attestation verify oci://ghcr.io/drumandbytes/pve-metrics-exporter:latest --owner drumandbytes
This confirms the image was built from this repo by the Build workflow.
How it was made
Built with the help of an AI coding assistant (Claude). I review and test what gets published.
License
MIT
Install pve-metrics-exporter on Unraid in a few clicks.
Find pve-metrics-exporter in Community Apps on your Unraid server, review the template, and click Install. Unraid handles the Docker app or plugin setup from the published template.
Categories
Related apps
Explore more like this
Explore allDetails
ghcr.io/drumandbytes/pve-metrics-exporter:latestRuntime arguments
- Web UI
http://[IP]:[PORT:9221]/metrics- Network
bridge- Privileged
- false
Template configuration
Metrics port (/metrics and /api/summary).
- Target
- 9221
- Default
- 9221
- Value
- 9221
Base URL of the Proxmox API.
- Target
- PROXMOX_URL
- Default
- https://192.168.1.10:8006
- Value
- https://192.168.1.10:8006
Full Authorization header value: PVEAPIToken=user@pve!tokenid=uuid
- Target
- PROXMOX_TOKEN
Proxmox ships a self-signed certificate; set false once replaced.
- Target
- PROXMOX_INSECURE_SKIP_VERIFY
- Default
- true
- Value
- true
celsius or fahrenheit (affects /api/summary only).
- Target
- TEMPERATURE_UNIT
- Default
- celsius
- Value
- celsius