
All apps · 0 apps

PlixMetrics
Docker app from ctrlaltd1337's Repository
Overview
Readme
View on GitHubPlixMetrics
A self-hosted, real-time Plex network monitoring dashboard. Track multiple Tautulli instances, visualize streaming activity on a world map, and analyze viewing statistics.
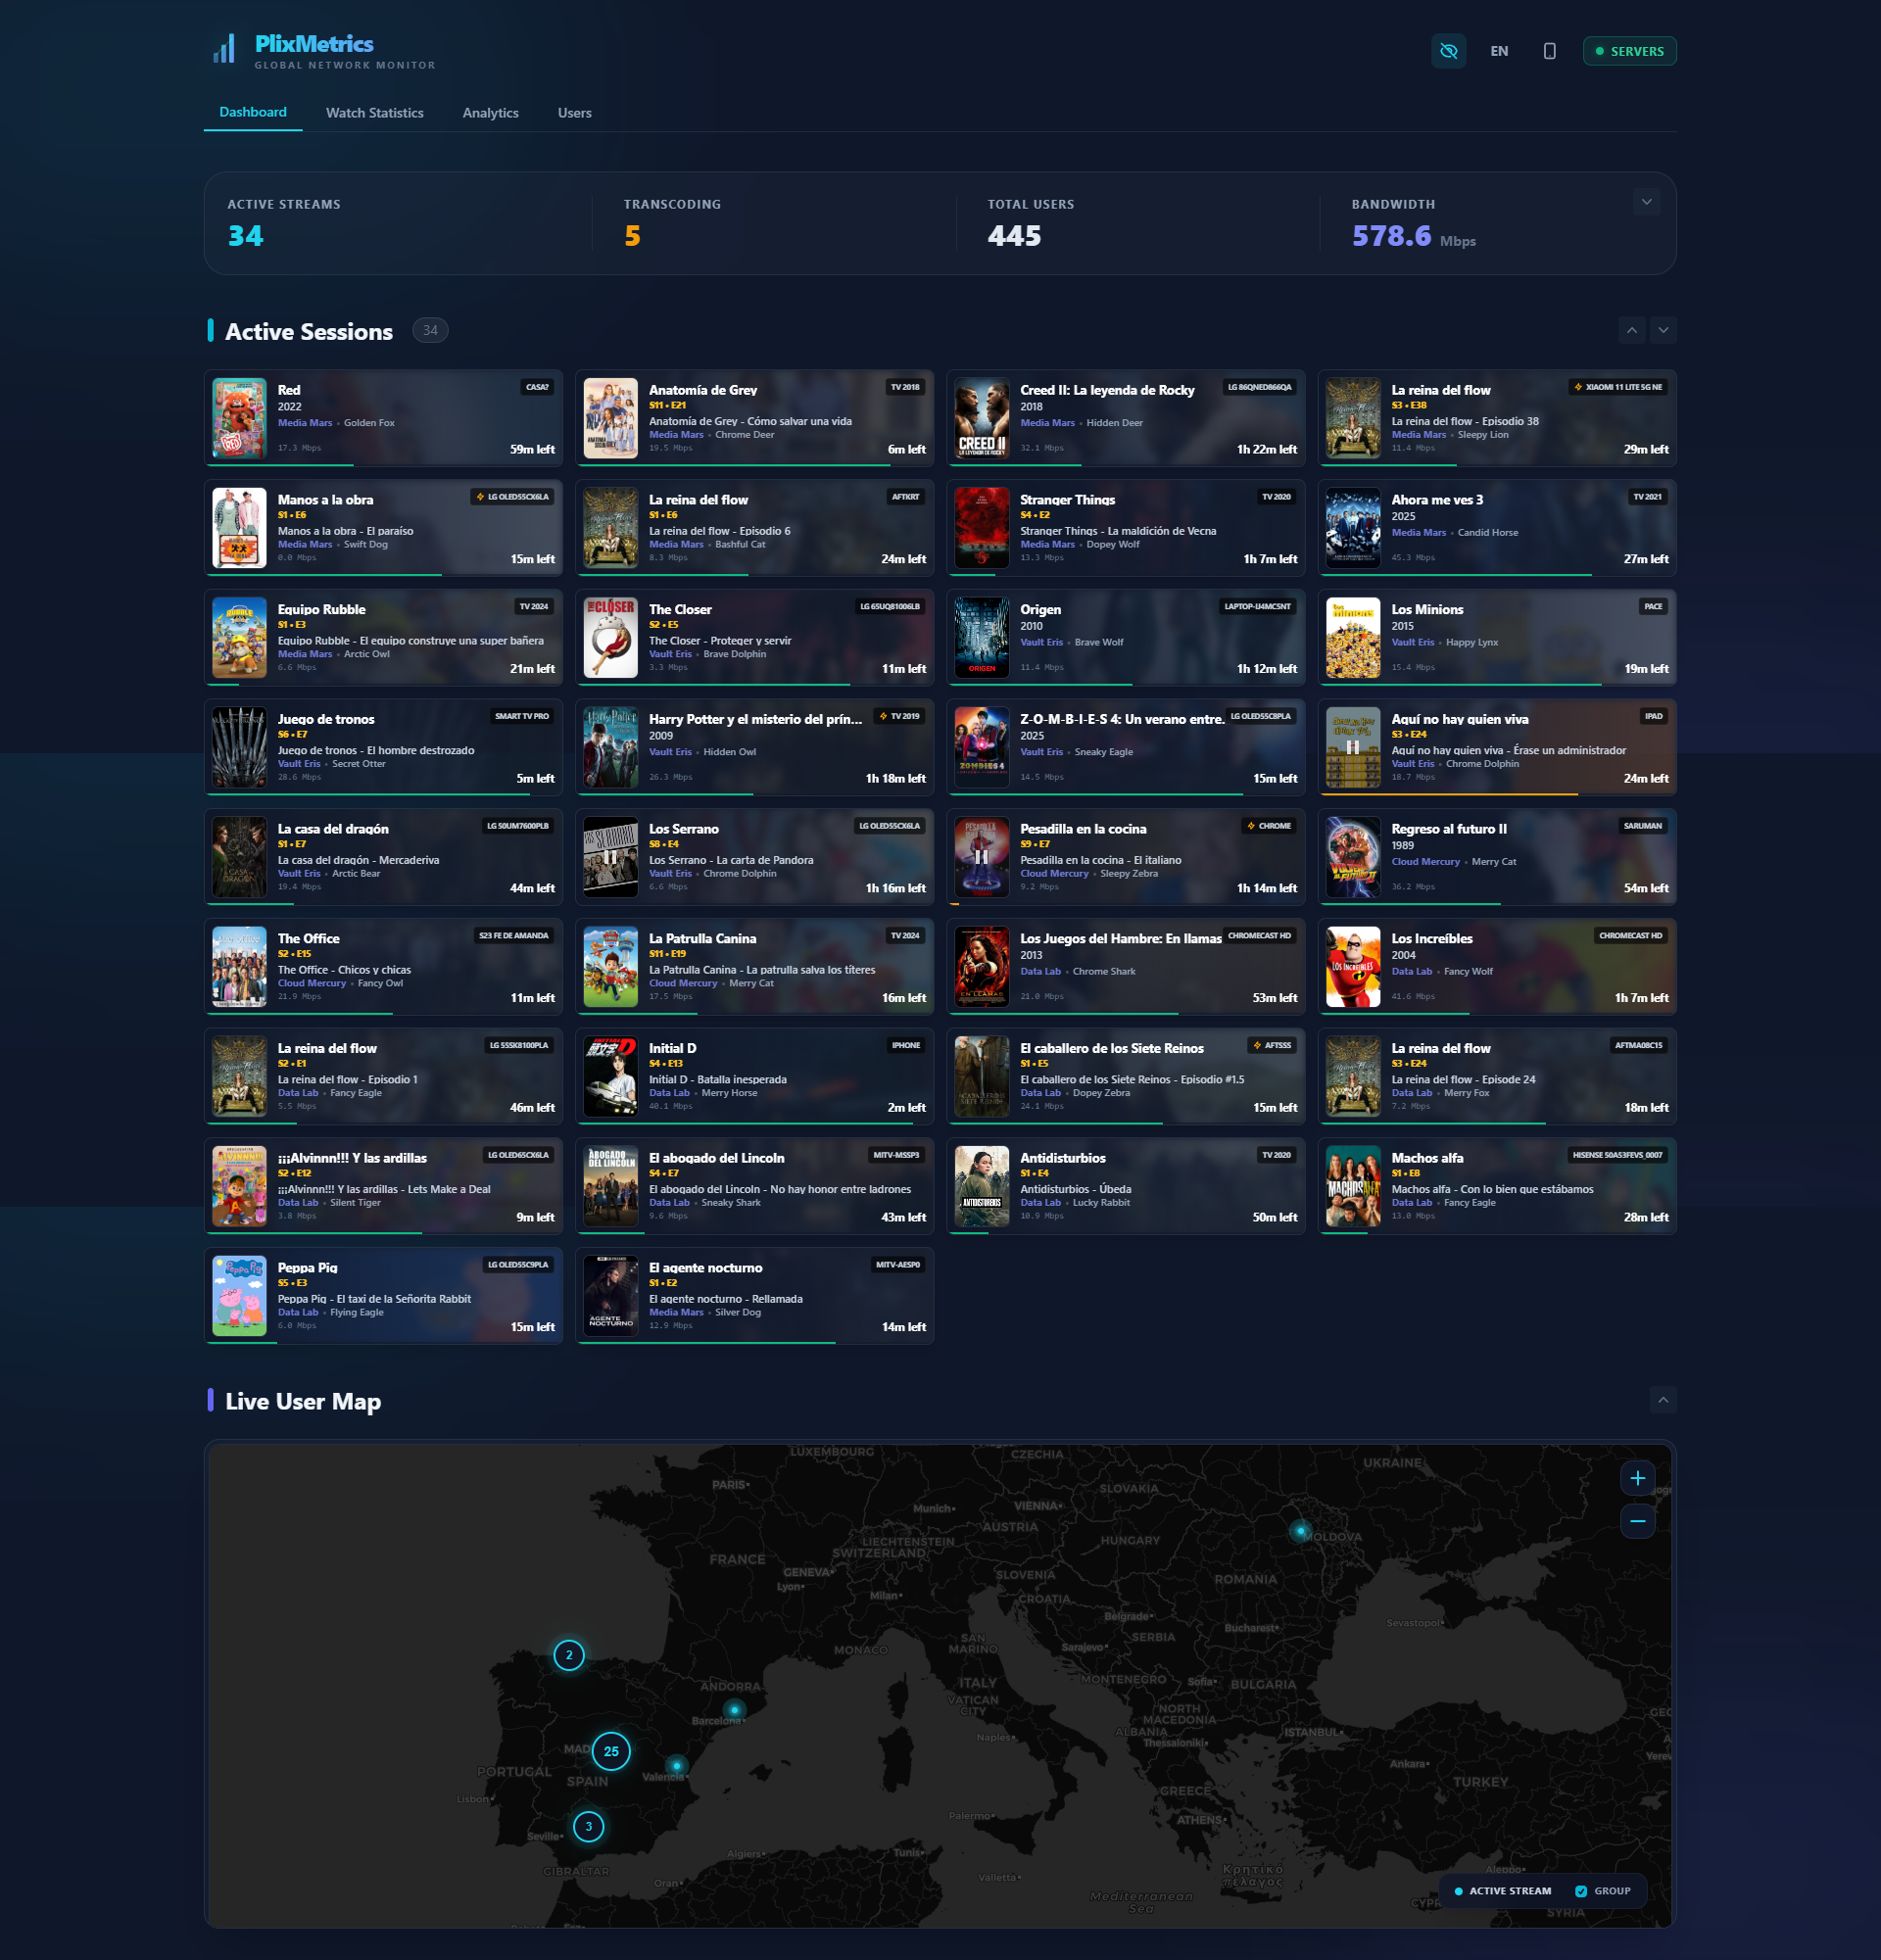
📸 Screenshots
| 📊 Statistics | 📈 Analytics |
|---|---|
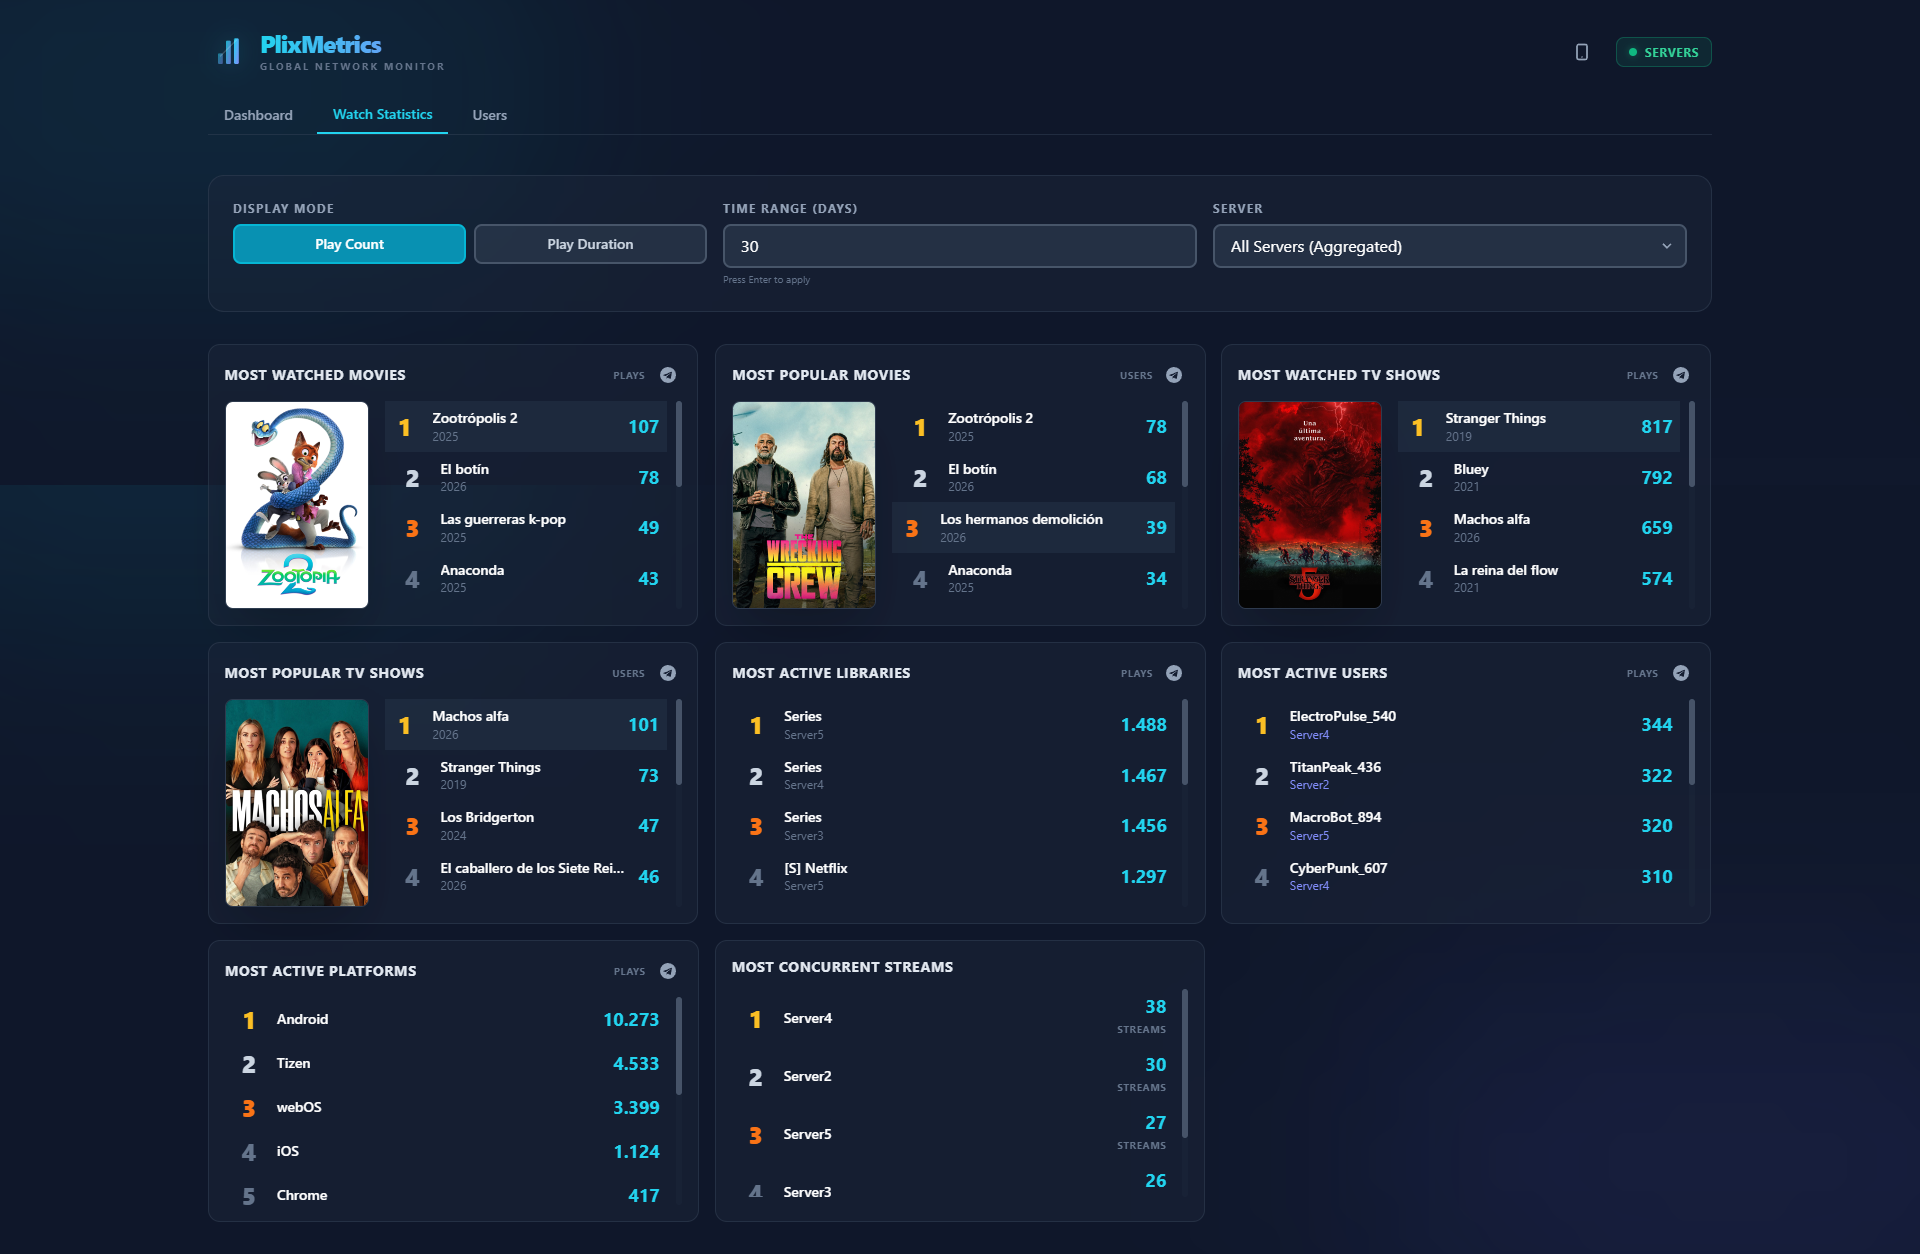 |
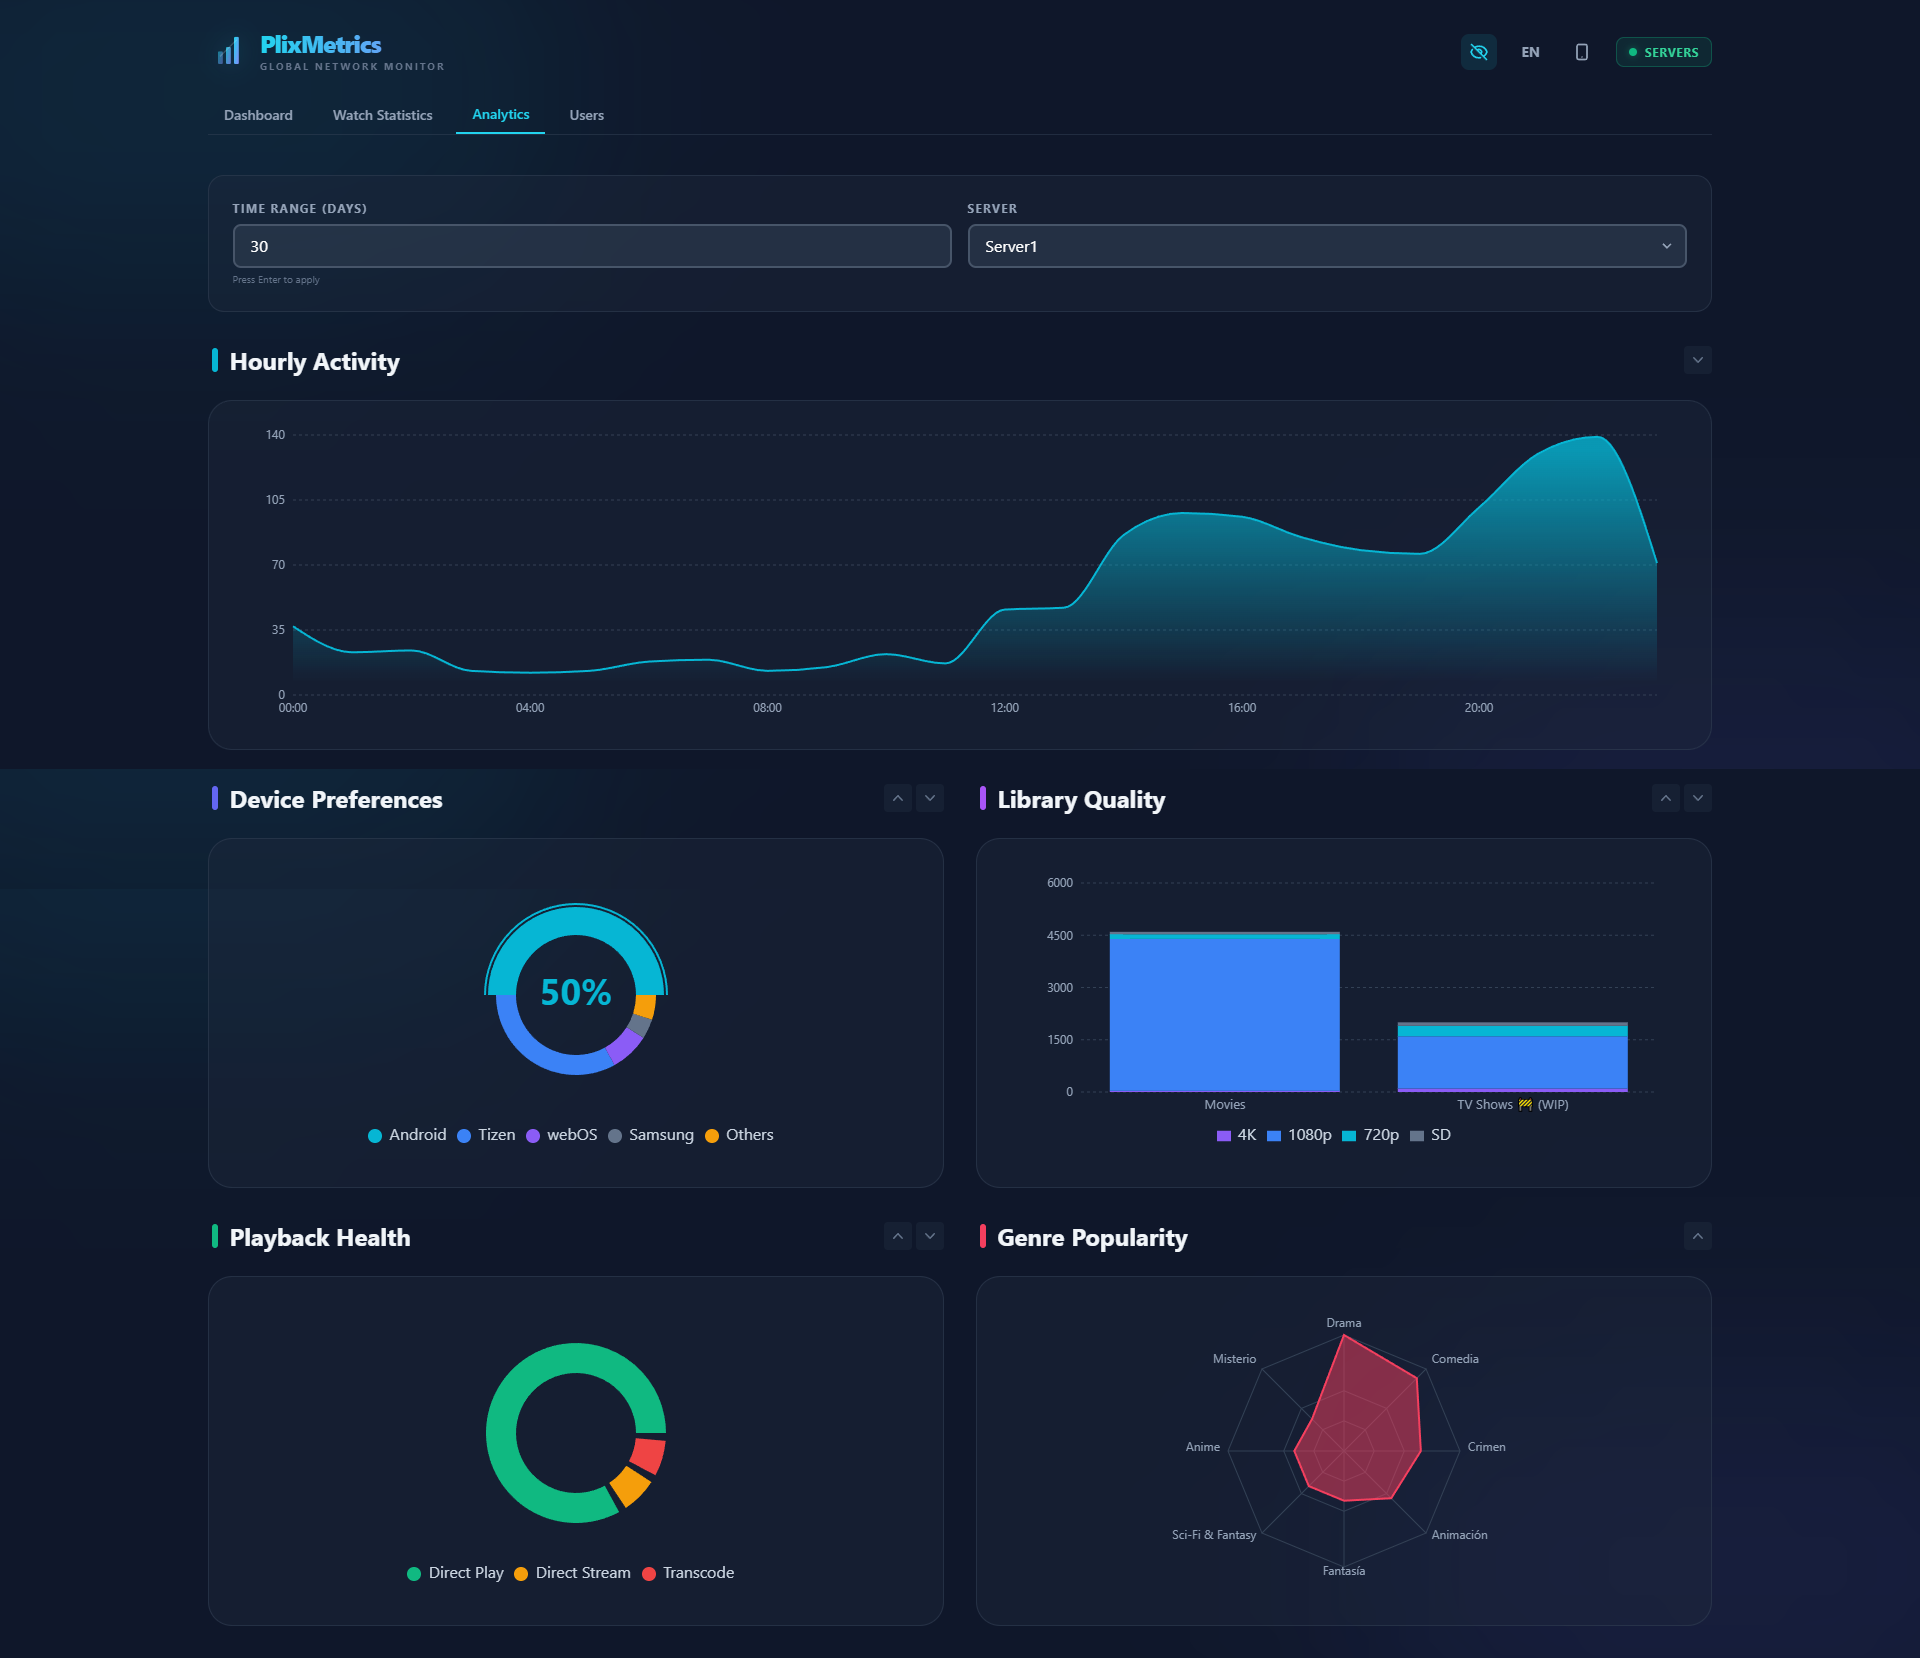 |
| 👥 Users | 📱 Mobile View |
|---|---|
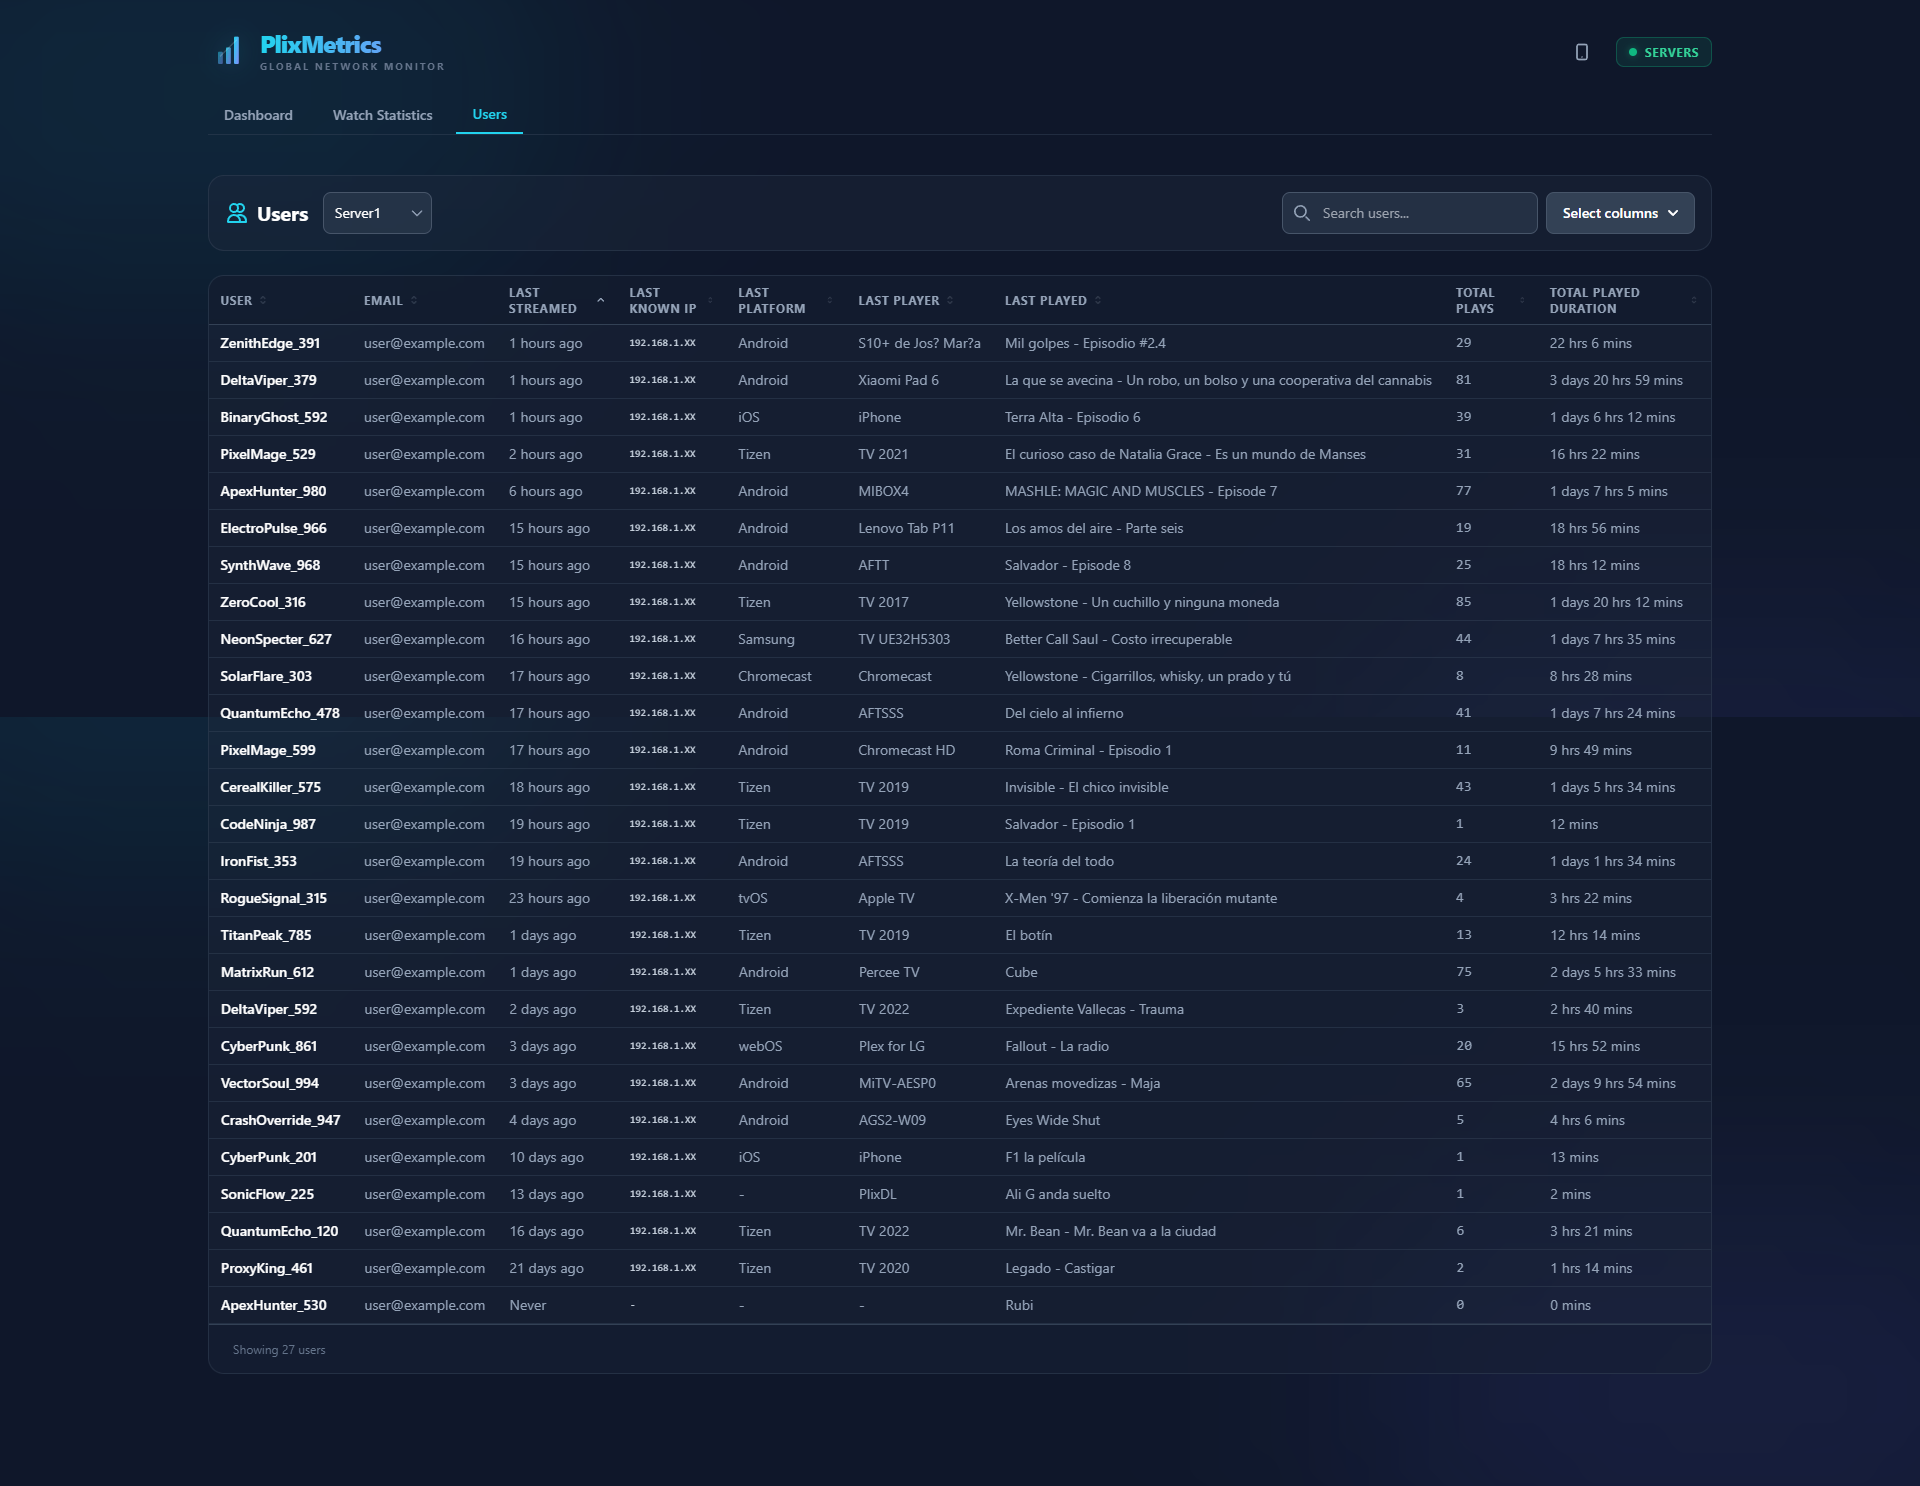 |
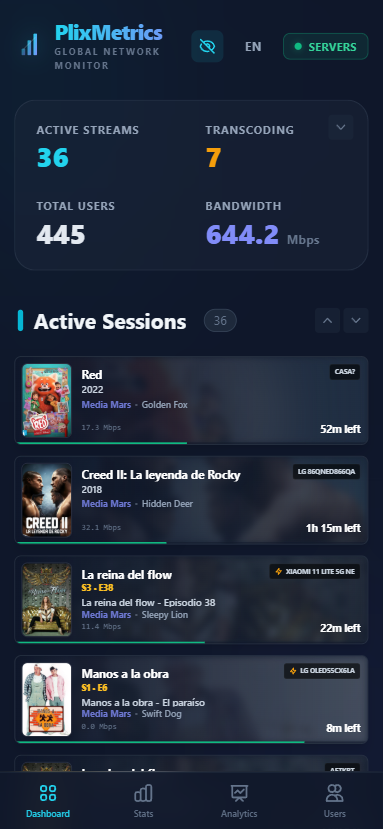 |
| ✨ Session Detail | 🧘 Zen Mode |
|---|---|
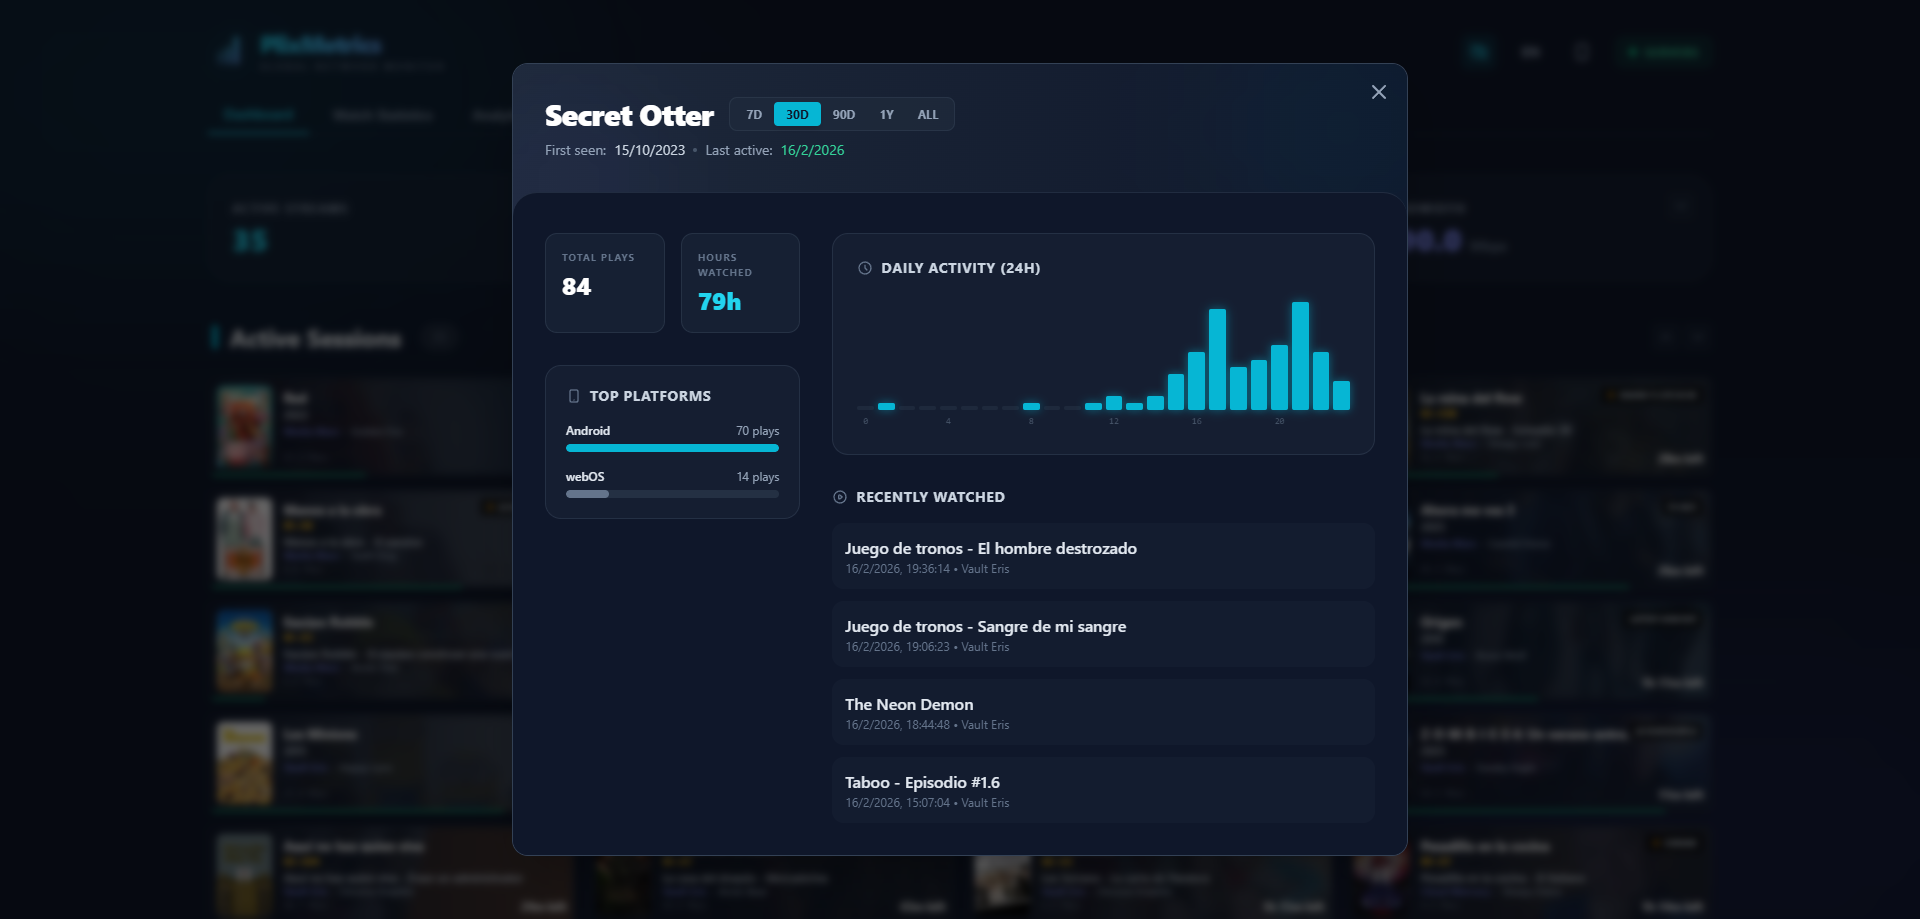 |
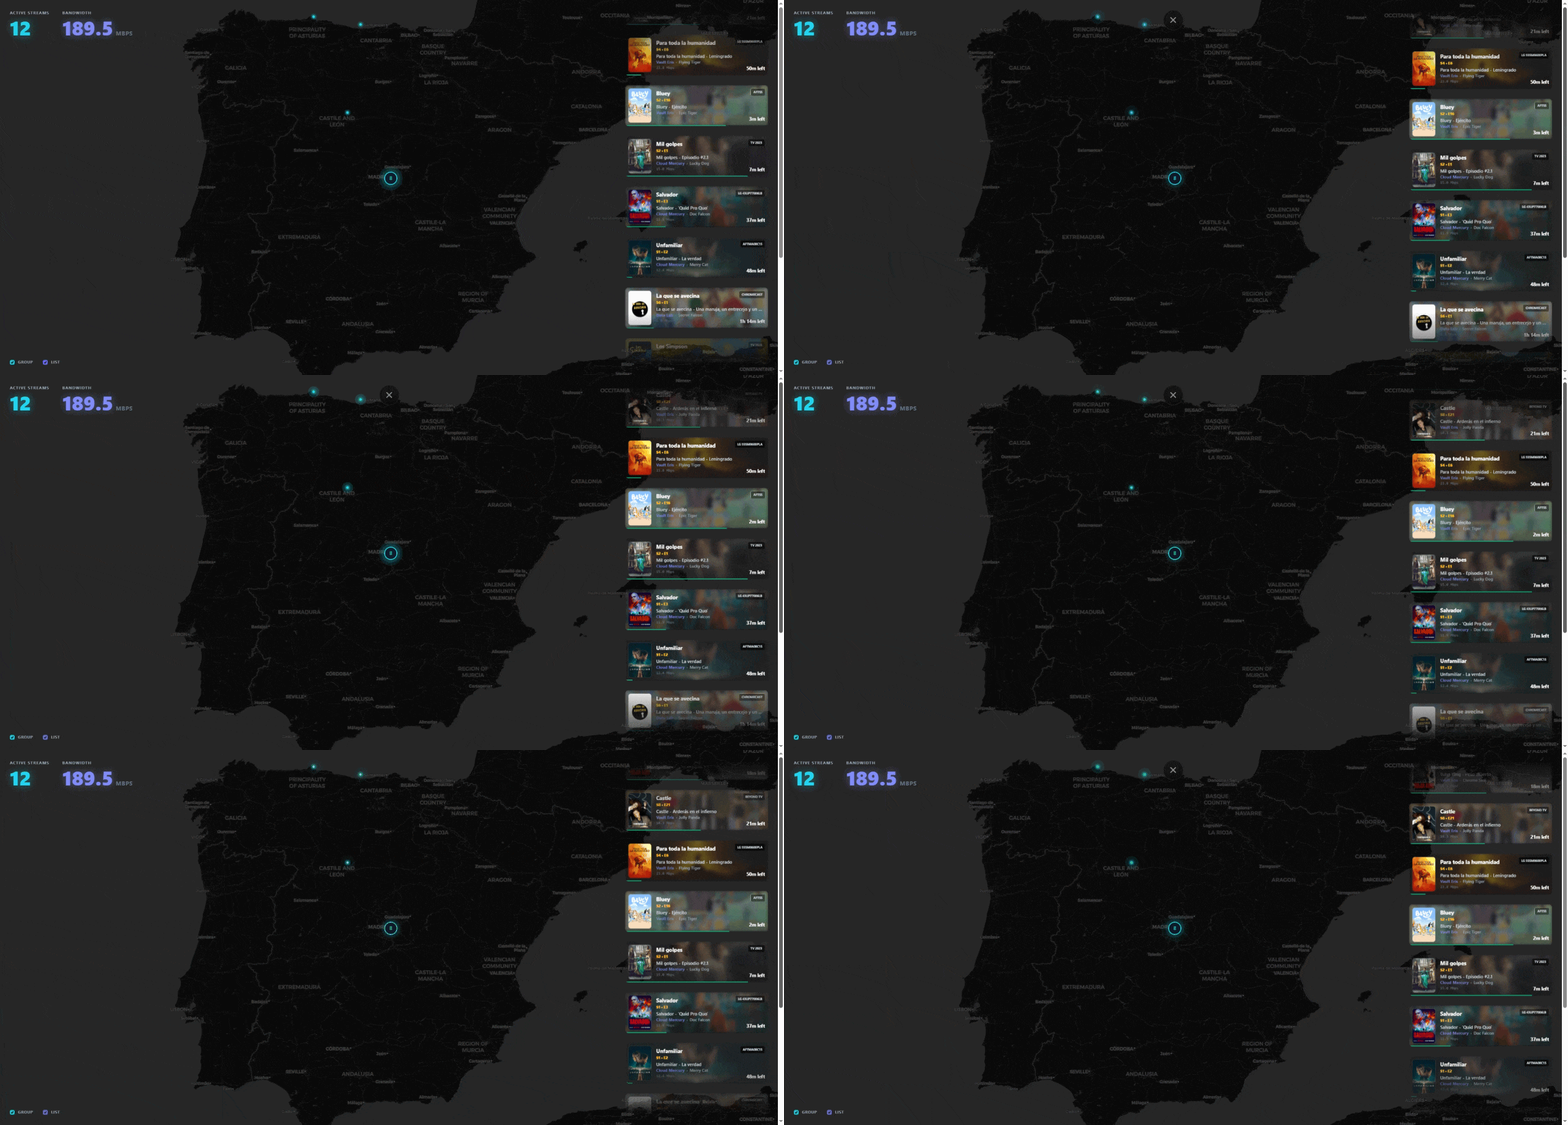 |
Features
- 🗺️ Live World Map - See where your streams are happening in real-time
- 📊 Real-time Statistics - Bandwidth, stream count, transcoding status
- 📈 Watch Statistics - Most watched movies, shows, users, platforms
- 🔒 Secure & Self-Hosted - Password protection, JWT authentication, and local data storage
- 🐳 Docker Ready - Easy deployment with Docker Compose
- 🖥️ Windows Native - Easy to use standalone installer (.exe) with auto-updates
- 🚀 Lightweight - Single container, SQLite database
- 📱 Mobile Ready - Responsive design with PWA support
- 🌍 Multi-language Support - Available in English, Spanish, French, Portuguese, German, Russian, and Chinese
- 🧘 Zen Mode - Immersive, full-screen map-only view with floating metrics
Installation & Deployment
Minimal Requirements
- Node.js: v20 or higher (for manual install)
- Docker: Engine 20.10+ (for Docker install)
- Memory: ~256MB RAM (very lightweight)
🐳 Method 1: Docker (Recommended)
Run the container directly from the GitHub Container Registry. No need to clone the repo or build manually!
1. Create a docker-compose.yml file:
version: '3.8'
services:
  plixmetrics:
    image: ghcr.io/plix-labs/plixmetrics:latest
    container_name: plixmetrics
    restart: unless-stopped
    ports:
      - "8282:8282"
    volumes:
      - plixmetrics-data:/data
    environment:
      - PORT=8282
      # Optional: set user/group ID if needed
      # - PUID=1000
      # - PGID=1000

volumes:
  plixmetrics-data:
2. Start the container:
docker-compose up -d
Access the dashboard at http://YOUR_SERVER_IP:8282.
Updating (Docker):
docker-compose pull && docker-compose up -d
📦 Method 2: Windows Installer (Easiest for Windows)
Download the latest standalone executable (.exe) from the Releases page.
Installation:
- Download
PlixMetrics-Setup-vX.X.X.exe. - Run the installer and follow the prompts.
- PlixMetrics will launch automatically in a console window, and your browser will open to the dashboard.
Features:
- Portable: Includes its own Node.js runtime (no need to install Node separately).
- Auto-Updates: Checks for new versions on startup and updates itself automatically.
- Persistent Data: All data is stored in
%APPDATA%\PlixMetrics.
To uninstall, use Windows "dApps & features" or run unins000.exe in the installation folder.
🛠️ Method 3: Manual Installation (Linux/Node.js)
If you prefer running directly on the metal or in an LXC container.
1. Clone the repository:
git clone https://github.com/plix-labs/PlixMetrics.git
cd PlixMetrics
2. Install Dependencies:
# Install root dependencies
npm install

# Install server dependencies
cd server && npm install && cd ..
3. Build the Application: This compiles both the React frontend and the Node.js backend.
npm run build:all
4. Start the Application:
npm start
5. (Optional) Run in background with PM2: To keep the app running after you close the terminal, use PM2:
# Install PM2 globally
sudo npm install -g pm2

# Start PlixMetrics
pm2 start npm --name "plixmetrics" -- start

# Save process list to resurrect on reboot
pm2 save
pm2 startup
Configuration & Usage
1. Initial Setup
On your first visit to http://YOUR_SERVER_IP:8282, you will be prompted to create an Admin Password. This password secures your dashboard from unauthorized remote access.
Note: Access from localhost is automatically authorized.
2. Connect Tautulli
PlixMetrics relies on Tautulli for data. You must have Tautulli installed and running.
- Click the "Servers" button in the dashboard or "Settings".
- Click "Add Server".
- Fill in the details:
- Name: A friendly name (e.g., "My Plex Server").
- URL: The full URL to Tautulli (e.g.,
http://192.168.1.50:8181). - API Key: Find this in Tautulli under Settings -> Web Interface -> API Key.
3. Mobile App (PWA) Setup 📱
PlixMetrics is a Progressive Web App. You can install it on your phone for a native-like experience.
- On your PC dashboard, click the Phone Icon (📱) in the header.
- Scan the QR Code with your mobile phone.
- On your phone, tap "Add to Home Screen" in your browser menu.
- Launch it from your home screen for a full-screen experience.
4. 🧘 Zen Mode (Minimal View)
A distraction-free, immersive view designed for dedicated monitoring screens or a clean dashboard experience. It features a full-screen map with floating real-time metrics and no UI clutter.
Desktop Access:
- Enter: Press
ZorFkeys while on the dashboard. - Exit: Press
ESCkey or click the floating X close button (which appears automatically when moving the mouse). - Interactive: A minimalist "Group" checkbox is available in the bottom-left to toggle marker clustering.
Mobile Access:
- Enter: Rotate your device to Landscape orientation. A "Minimal View" (monitor icon) will appear in the top header; tap it to activate the mode.
- Exit: Simply rotate your device back to Portrait orientation.
🌐 Remote Access (Outside Home Network)
There are two ways to access PlixMetrics from anywhere in the world:
Option A: Direct IP + Port (Easiest)
You can access PlixMetrics via http://YOUR_IP:8282.
- Find your Public IP: Search "what is my ip" on Google.
- Port Forwarding: Log into your router's admin page and forward port 8282 (TCP) to the internal IP of your server.
- Access: Open
http://YOUR_PUBLIC_IP:8282in your browser. You will be asked to log in.
Option B: Reverse Proxy (Advanced & Secure)
If you have a domain (e.g., stats.yourdomain.com) and want to use HTTPS.
Nginx Example:
server {
    listen 80;
    server_name stats.yourdomain.com;

    location / {
        proxy_pass http://localhost:8282;
        proxy_http_version 1.1;
        proxy_set_header Upgrade $http_upgrade;
        proxy_set_header Connection 'upgrade';
        proxy_set_header Host $host;
        proxy_cache_bypass $http_upgrade;
    }
}
🔌 Port Configuration
The default port is 8282.
How to change it (Docker):
Edit docker-compose.yml:
ports:
  - "3000:8282"  # Format is HOST:CONTAINER. Change the left side to your desired port.
How to change it (Manual):
# Linux/Mac
PORT=8282 npm start

# Windows (Powershell)
$env:PORT=8282; npm start
Environment Variables
| Variable | Default | Description |
|---|---|---|
PORT |
8282 |
Server port |
DATA_DIR |
./data |
Directory for SQLite database |
JWT_SECRET |
(random) | Secret key for authentication tokens |
NODE_ENV |
production |
Environment mode |
Architecture
PlixMetrics/
├── src/                    # React frontend
├── server/                 # Express.js backend
│   └── src/
│       ├── routes/         # API endpoints
│       ├── services/       # Business logic (Auth, System, Tautulli)
│       └── db/             # SQLite schema
├── Dockerfile              # Multi-stage build
└── docker-compose.yml      # Easy deployment
Tech Stack
- Frontend: React, TypeScript, Tailwind CSS, React Query
- Backend: Node.js, Express.js, TypeScript
- Database: SQLite (better-sqlite3)
- Containerization: Docker
API Endpoints
| Endpoint | Method | Description |
|---|---|---|
/api/auth/login |
POST | Login and get token |
/api/auth/setup |
POST | Initial admin setup |
/api/servers |
GET | List all servers |
/api/servers |
POST | Add a server |
/api/network |
GET | Get network status |
/api/stats |
GET | Get watch statistics |
/api/system/version |
GET | Check for updates |
/api/health |
GET | Health check |
License
GNU GPLv3 License - see LICENSE for details.
Made with ❤️ for the Plex community
Categories
Related apps
Explore more like this
Explore allDetails
ghcr.io/plix-labs/plixmetrics:latestRuntime arguments
- Web UI
http://[IP]:[PORT:8282]- Network
bridge- Shell
sh- Privileged
- false
Template configuration
- Target
- 8282
- Default
- 8282
- Value
- 8282
- Target
- /data