

plex-exporter
Docker app from cplieger's Repository
Puts your Plex server's streams, transcodes, bandwidth and library sizes into Prometheus, so you can watch them in Grafana and get alerts.
Requirements
Plex URL: the full URL of your Plex server including scheme and port, for example http://192.0.2.100:32400.
Plex Token: the server administrator's token. Plex's guide Finding an authentication token shows where to find it: https://support.plex.tv/articles/204059436-finding-an-authentication-token-x-plex-token/
Host CPU, memory and bandwidth metrics require Plex Pass. Everything else works without it.
A rejected token, a wrong URL or a TLS error keeps the exporter running and shows as an alert, not a stopped container. A missing or malformed setting still stops it at start.
The metrics endpoint and the health check have no login, so keep port 9594 on your LAN.
Overview
Readme
View on GitHubplex-exporter
Image Size Platforms base: Distroless Mutation SBOM
plex-exporter puts your Plex server's streams, transcodes, bandwidth and library sizes into Prometheus, so you can watch them in Grafana and get alerts. It only reads from Plex. Your own Prometheus and Grafana store and show the data.
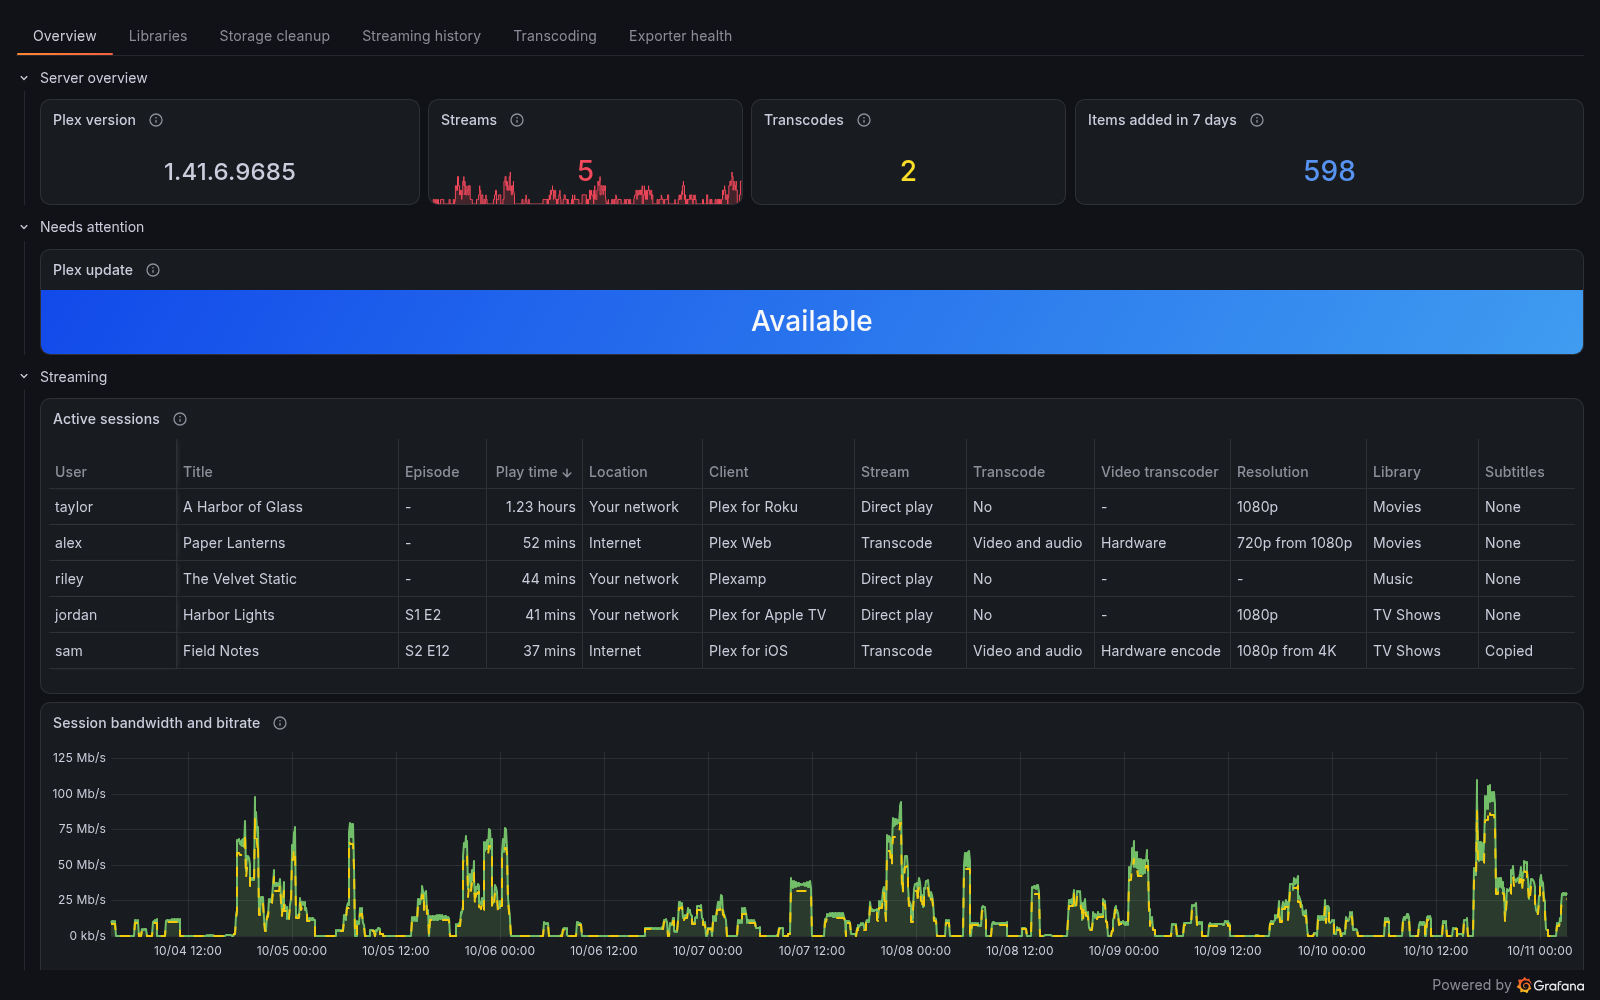
What it does
plex-exporter lets you follow your Plex server in Grafana and alerts you to problems.
- Shows who watches what, on which device, and whether it plays directly or transcodes on your GPU or CPU.
- Tracks each stream's bandwidth and bitrate, and whether the viewer is local or remote.
- Counts each library's items, length and disk space, and lists its largest items with their last play.
- With Plex Pass, adds the server's CPU and memory use and upload traffic.
- Ships a Grafana dashboard and ten alert rules, one for a rejected token.
Who it is for
plex-exporter is built for Plex server owners. It checks Plex for streams every 5 seconds, so a new stream appears within seconds.
You need a Plex Media Server and its admin token. You also need Prometheus and Grafana, plus Alertmanager for the alerts, as the monitoring guide sets up. Grafana Alloy can scrape the metrics instead. Run one container for each Plex server. Its metrics page has no login, so keep it on your own network.
Consider Tautulli if you want a web app made for Plex, with watch history, per-user statistics and notifications for streams and recently added media.
plex-exporter is free software under the GPL-3.0-or-later license.
Quick start
The image is on GitHub Container Registry and on Docker Hub as cplieger/plex-exporter, for amd64 and arm64. Both have the same images and tags. This is the compose.yaml in this repository.
services:
  plex-exporter:
    image: ghcr.io/cplieger/plex-exporter:latest
    container_name: plex-exporter
    restart: unless-stopped

    # Set both values in a .env file next to this one before the first start.
    environment:
      - PLEX_URL  # the address you open Plex at from another device, such as http://192.0.2.10:32400
      - PLEX_TOKEN  # your Plex admin token, found with Plex's guide "Finding an authentication token"

    ports:
      - "9594:9594"
Sign in to Plex Web as the server's owner and find your token with Plex's guide, Finding an authentication token.
Next to
compose.yaml, create a file named.envwith these two lines. Put in your token and the address you open Plex at from another device on your network, notlocalhost.PLEX_URL=http://192.0.2.10:32400 PLEX_TOKEN=your-plex-tokenUse
http://plex:32400only when your Plex container is namedplexand shares a Docker network with this one.Run
docker compose up -d.Add this scrape job to your Prometheus configuration, with your Docker host's address in place of
192.0.2.20. The shipped alert rules expect the job nameplex-exporter.
scrape_configs:
  - job_name: plex-exporter
    static_configs:
      - targets: ["192.0.2.20:9594"]
Run docker logs plex-exporter. You should see connected to plex server with your server's name. If you see cannot connect to plex server with 401 Unauthorized, the token is wrong.
On Unraid, open the Apps tab, search for plex-exporter and click Install.
Adding the Grafana dashboard
The repository ships grafana-dashboard.json, the Plex Exporter dashboard built on these metrics. It needs Grafana 13.2 or newer.
Each release's dashboard matches the metrics that image serves, so load the copy from the release that matches your image tag. Importing an app's dashboard shows how. Every release names the dashboard plex-exporter, so importing a newer copy and choosing Import (Overwrite) updates it in place. Monitoring and alerts lists the release download and the OCI artifact for automated delivery.
On Grafana 13.1 or older, take grafana-dashboard.json from release v4.1.3, the last one in the older dashboard format. That file gets no further changes, so you maintain it yourself.
Configuration reference
Every setting is an environment variable, read once at start. Run docker compose up -d again after a change.
| Variable | Description | Default |
|---|---|---|
PLEX_URL |
Your Plex server's address with scheme and port, such as http://192.0.2.10:32400 |
required |
PLEX_TOKEN |
The admin token of your Plex server. Leave it out when PLEX_TOKEN_FILE is set |
required |
PLEX_TOKEN_FILE |
Path to a file holding the token, such as a Docker secret. It takes precedence over PLEX_TOKEN and keeps the token out of docker inspect |
(unset) |
LISTEN_ADDR |
Address and port the metrics server listens on | :9594 |
PLEX_CA_CERT_PATH |
Path inside the container to the PEM file of the CA that signed your Plex certificate. TLS verification stays on | (unset) |
The exporter strips one trailing line ending from the token file, and refuses to start when the file holds only whitespace.
Which TLS setting you need depends on your PLEX_URL:
Your PLEX_URL looks like |
What to do |
|---|---|
http://plex:32400 or another http:// address |
Nothing, because TLS is not in use |
https://<hash>.plex.direct:32400, with Plex's own certificate |
Nothing, because a public CA signed it |
https://192.0.2.10:32400 or https://plex.local, with a self-signed or private CA |
Mount the CA's PEM file and set PLEX_CA_CERT_PATH to its path |
| Port | Description |
|---|---|
9594 |
Prometheus metrics at /metrics and the health check at GET /healthz |
The exporter writes no file, so it needs no volume.
Security
Keep port 9594 on your own network. The metrics page has no login, and its labels carry Plex user names, device names and the titles being played.
The exporter only connects out, to the Plex server you configure. It sends the token in a request header, never logs it and never puts it in a metric. TLS verification always stays on, and PLEX_CA_CERT_PATH adds a private CA instead of turning verification off. The image runs as a non-root user on a distroless base, with no shell or package manager.
Security covers the read-only compose settings, the limits the exporter enforces and what the image contains.
Troubleshooting
The image's healthcheck runs /plex-exporter health, which asks GET /healthz on the exporter's own port. Knowing the app is alive says what it proves and who is told.
The container exits at startup when PLEX_URL is unset or is not an http or https address with a host. It also exits when neither PLEX_TOKEN nor PLEX_TOKEN_FILE supplies a token, or the token file cannot be read. It exits when the PLEX_CA_CERT_PATH file cannot be read or holds no certificate, or the listen address cannot be bound. Docker then restarts it.
Any error from Plex, such as a rejected token, a 404, a TLS failure, a timeout or a 5xx, leaves it running and healthy, with the plex_http_reachable metric at 0. It retries every 5 seconds.
- The log shows
cannot connect to plex serverwith401 Unauthorized. The token is wrong or revoked, so find it again with step 1 of the quick start. - The log shows
initial plex connection failed; starting in degraded state. The exporter cannot reachPLEX_URLyet, so try that address from another device. - Host CPU, memory and
plex_transmit_bytes_totalare missing. They need Plex Pass, and appear once Plex has answered for them. - A library's item count lags after a large scan, because counts are read every 15 minutes.
Monitoring
plex-exporter serves 49 metrics on /metrics, for the exporter itself, the server, its libraries, their contents and each stream. Each stream adds at most five series, and it tracks 256 streams at most. The page also carries the Go runtime and process metrics that stock Go dashboards read. Ten Prometheus alert rules ship in alerts/promql.yaml, and the bundled dashboard needs Grafana 13.2 or newer. Metrics reference lists every metric, and Monitoring and alerts every rule and how to load it.
Documentation
- How plex-exporter works explains how often it reads Plex and when each metric appears.
- Metrics reference lists every metric and label, for building your own panels.
- Monitoring and alerts lists the alert rules, the log lines, the dashboard downloads and the health checks.
- Security covers the read-only compose settings, the exporter's limits and what the image contains.
- Running on Kubernetes covers probes, a sidecar setup, Prometheus Operator labels and dashboard delivery.
Credits
- The metric and label names follow prometheus-plex-exporter by @jsclayton, the Grafana Hackathon 2022 exporter this project builds on.
- The
plex_library_itemsmetric with itscontent_typelabel, and thetranscode_typeandsubtitle_actionlabels, follow the @timothystewart6 fork of that exporter. - It reads the Plex Media Server API and serves its metrics with measure, a Prometheus metrics library with no dependencies.
Contributing
See CONTRIBUTING.md.
Disclaimer
This project is built with care and follows security best practices, but it is intended for personal / self-hosted use. No guarantees of fitness for production environments. Use at your own risk.
This project was built with AI assistance. The human maintainer defines architecture, supervises implementation, and makes all final decisions.
License
GPL-3.0-or-later. See LICENSE. The image carries the license text of every bundled component under /usr/share/licenses/.
Third-party attributions are in THIRD_PARTY_NOTICES.md.
Categories
Download Statistics
Total Downloads Over Time
Related apps
Explore more like this
Explore allLinks
Details
cplieger/plex-exporter:latestRuntime arguments
- Web UI
http://[IP]:[PORT:9594]/metrics- Network
bridge- Privileged
- false
Template configuration
Full URL of your Plex Media Server including scheme and port, for example http://192.0.2.100:32400
- Target
- PLEX_URL
Plex authentication token of the server administrator. Plex's guide: https://support.plex.tv/articles/204059436-finding-an-authentication-token-x-plex-token/
- Target
- PLEX_TOKEN
Prometheus metrics at /metrics and health at /healthz
- Target
- 9594
- Default
- 9594
- Value
- 9594
Only for an https Plex URL with a self-signed or private-CA certificate. The path of the CA PEM file inside the container, with a matching path mapping
- Target
- PLEX_CA_CERT_PATH