
Overlook
Docker app from bnlqn's Repository
Overview
Readme
View on GitHubOverlook


One page that tells you whether your homelab is fine.
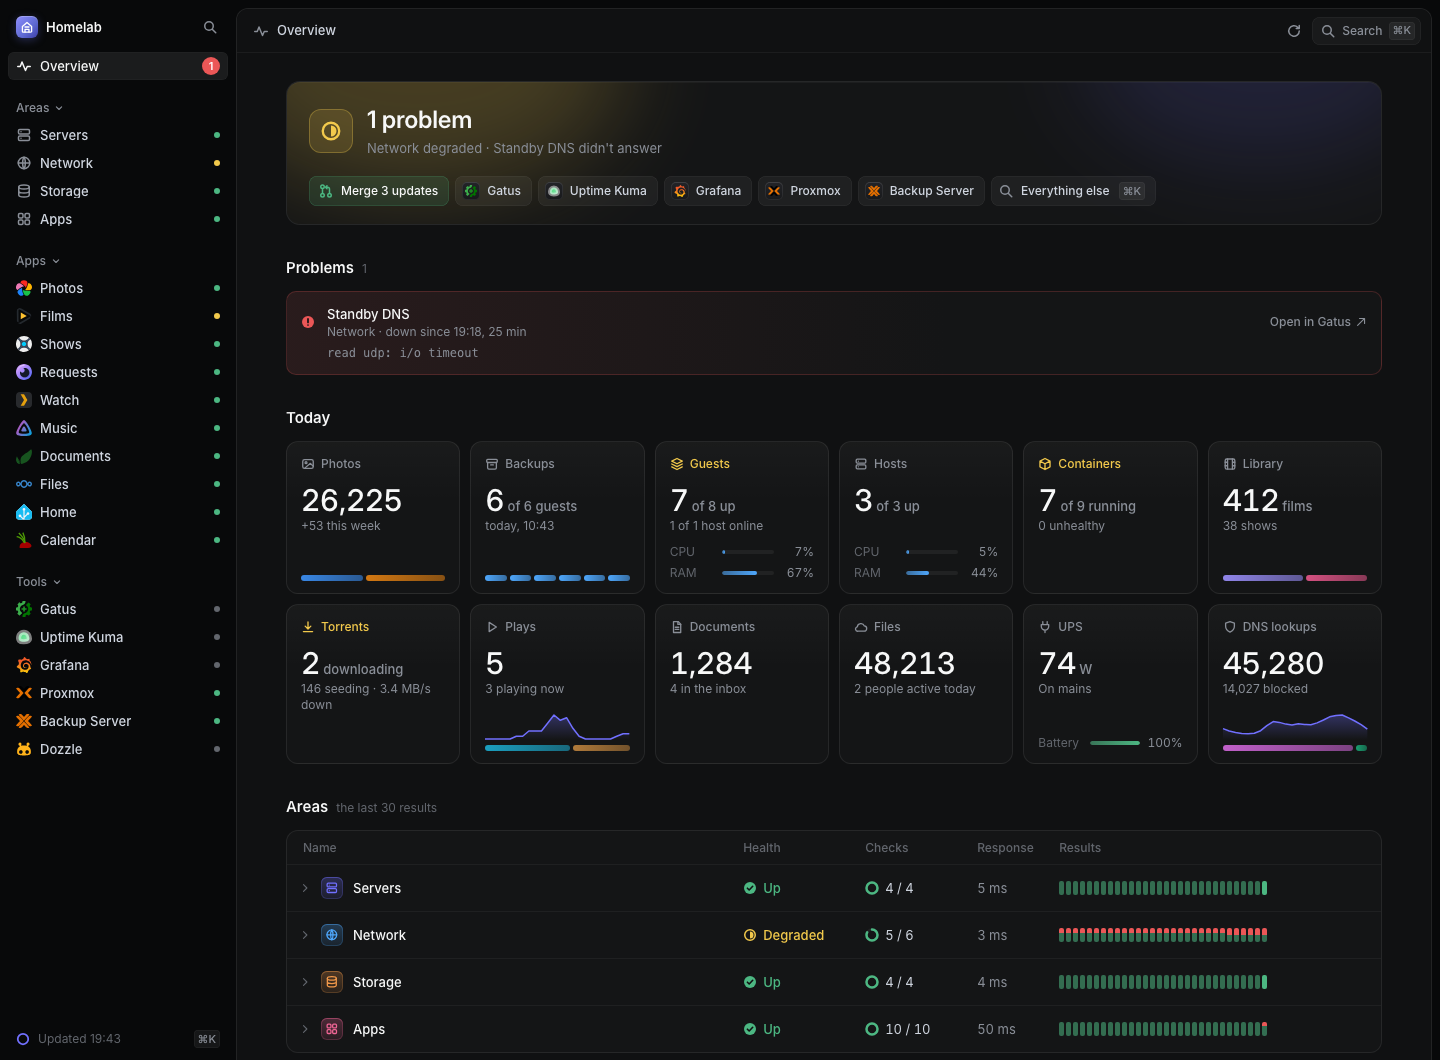
What's wrong, how each area of the homelab is, and what it did today and this week, on one page that is the same for every homelab. Overlook reads the tools you already run and changes nothing. See the demo, drawn from a homelab that doesn't exist.
It reads:
- Check engines: Gatus, Uptime Kuma, Grafana, Prometheus and Alertmanager, Checkmate
- Servers: Proxmox VE, Beszel, Docker, NUT
- Network: UniFi Network, AdGuard Home, Pi-hole
- Storage: Proxmox Backup Server
- Apps: Immich, Jellyfin, Emby, Plex, through Tautulli, Radarr, Sonarr, Prowlarr, qBittorrent, Seerr, Home Assistant, Paperless-ngx, Nextcloud
- Chores: GitHub, iCalendar to-do lists
What it can't read, and why, is under Can't be read.
What it shows
- What's wrong: the problems, which are the checks your check engine alerts on, for as long as they fail. Overlook runs no check and sends no alert, so the page and your alerts always agree.
- How each area is: Servers, Network, Storage and Apps, each up, degraded (a problem, but it still works, such as DNS with one of two resolvers down) or down, with its checks' last 30 results and a page of its own with what its sources add, such as a host's guests or a resolver's top clients.
- Today: a figure from each source, such as guests up, DNS lookups, photos or what the UPS draws.
- This week: each area's problems and events along the last seven days, and the list of what happened, as far as your sources remember it.
- Your apps and tools, each a link with a dot that says whether it answers.
- The chores: the ones on your to-do list that are due or come this week, the updates waiting for your merge or to be installed, the batteries to change, the devices waiting to be adopted and the requests waiting for your approval. You do a chore where it waits, such as marking it done on the list, never on the page, and a chore is never a problem.
What it never does
- It never changes anything. Overlook sends a source only GET requests, and a login where a source offers no other way in, which changes nothing but a session; it sends NUT only LIST VAR, which reads. The client it reads with refuses every other request. Some keys it holds could do anything (AdGuard Home has no read-only users, and Radarr's and Sonarr's keys are admin keys), and this is what keeps them harmless. Tautulli changes things on GET too, so its adapter sends only the commands that read, from a list its test checks (ADR 0011).
- It never runs a check or sends an alert. Your check engine does both.
- It remembers nothing. No database and no volume: it reads every source when the page asks, at most every 30 seconds, so an Overlook nobody looks at sends nothing into your homelab. What happened this week is what your sources remember.
- It never sends a key to the browser. The server reads every source and gives the page a snapshot of what it read, never a key or a source's own answer.
- It never asks where to put things. The page is fixed: your config says which sources fill it, never where anything goes. There are no widgets to arrange.
- It never calls anywhere you didn't name. No telemetry and no update check; the page's fonts and icons come from Overlook itself.
Quick start
Overlook is one container. Give it a folder of its own for its config,
beside a compose.yaml:
overlook/
compose.yaml
# compose.yaml
services:
  overlook:
    image: ghcr.io/bnlqn/overlook:0.5
    restart: unless-stopped
    ports:
      - "8080:8080"
    volumes:
      - ./overlook:/etc/overlook:ro # the config and its keys, read-only: Overlook writes nothing
    environment:
      TZ: Europe/Brussels           # when today starts
    read_only: true                 # Overlook writes nothing,
    cap_drop: [ALL]                 # needs no Linux capability,
    security_opt: ["no-new-privileges:true"] # and can gain none
Then docker compose up -d, and open port 8080 of that host. With no
config yet, Overlook shows its setup page: pick the tools your homelab
runs, give each its address and key, and try it. From the sources that
answered, the setup page puts together two files, overlook.yaml and the
.env that holds their keys. Save both in overlook/, then
docker compose restart, and the setup page, still open, turns into the
page. A source that didn't answer its try says what to do about it, such
as for a certificate Overlook doesn't trust. The log says which sources
Overlook reads, and the page names any that didn't answer.
The two files look like this, and you can write them yourself instead:
# overlook/overlook.yaml
sources:
  gatus:
    - url: http://gatus.example.com:8080
  proxmox:
    - url: https://pve.example.com:8006
      token: overlook@pve!overlook
      secret: ${PROXMOX_SECRET}       # from .env
      ca: /etc/overlook/pve-root-ca.pem # copied into overlook/

apps:
  - name: Photos
    url: https://photos.example.com
    icon: immich.svg
    check: Photos
# overlook/.env: the keys
PROXMOX_SECRET=00000000-0000-0000-0000-000000000000
- Keys come from
.env, beside the config, or from Overlook's environment, which wins. A${VAR}anywhere in the config is read from either, so the config holds no secret and can be shared or kept in git, while.envstays out of it. A${VAR}set in neither stops Overlook, and says which..envholds aNAME=valuea line, the value all that follows the first=, with no quotes taken off, so a key holding#or a quote stays whole; a line that starts with#is a comment. - The config is mounted read-only, at
/etc/overlook, with a CA file or your own icons beside it. The image runs as uid 65532, so the folder and its files must be readable by others, as they are by default. To keep.envfrom everyone else on the host, give it to that user:sudo chown 65532 overlook/.env && sudo chmod 600 overlook/.env. - The setup page is there only while there is no
overlook.yaml. A config that is there but wrong, an empty one too, stops Overlook, and says why. While the setup page is up, anyone who can open it can have Overlook read an address they type, as SECURITY.md says, so save the files soon. TZsays when today starts, for today's figures. Any zone works: the zone database is inside the binary.- The image is
ghcr.io/bnlqn/overlook, for amd64 and arm64:0.5for the newest 0.5 release, or a version such as0.5.0. It holds the binary and the CA certificates it checks HTTPS sources with, and nothing else.
Without Docker, each release has the binary for Linux on amd64 and arm64, such as for an LXC container or a Raspberry Pi:
overlook -config /etc/overlook/overlook.yaml -listen :8080
It reads .env beside the config there too, and shows the setup page until
the config exists.
On Unraid, add https://github.com/bnlqn/overlook under Template
repositories at the foot of the Docker page's Add Container, then pick
Overlook as the template and apply it. Its config folder is
/mnt/user/appdata/overlook, it runs locked down as above, and Unraid
gives it TZ itself. Its WebUI opens the setup page, which says how to
save the two files on Unraid. To link the Unraid server itself in the
sidebar, as a tool, give it icon: unraid.svg, which Overlook ships.
Configuring
overlook.example.yaml shows every source with
comments. Overlook reads the config once, at start, and refuses a key it
doesn't know, so a typo stops it rather than going unnoticed.
Sources. Under sources:, each adapter has a list, so two AdGuard Home
resolvers are two entries under adguard:. Each source has a name, which
the page uses. Each adapter gives one, such as Gatus, and two sources can't
share one, so two of one adapter need names of their own. With two of one
adapter, the page names each one's sections, figures and events, and adds up what
adds up, such as two Proxmox hosts' guests, split by source.
What each adapter reads, its config and the least key it needs are under
Adapters below.
Areas. The page has four, always the same: Servers, Network, Storage
and Apps, and an area with nothing in it isn't shown. Each adapter puts
its parts in its own area, such as Proxmox VE in Servers and AdGuard Home
in Network. A check goes in the area its group in the check engine is
named after, or the one the config gives that group, as in Gatus's
areas:. A check in no area still counts, and its problems still show.
Apps and tools. Apps are what the homelab hosts for the people who use it; tools are what you run it with. Both are links on the page, in the sidebar and in ⌘K:
apps:
  - name: Photos                     # the only key besides url it needs
    url: https://photos.example.com
    icon: immich.svg                 # a file in overlook/icons/, one Overlook ships, or a URL
    check: Photos                    # the check that lights its dot
    description: The family's photos
    color: "#ED79B5"                 # tints its tile
tools:
  - name: Proxmox
    url: https://pve.example.com:8006
    icon: proxmox.svg
    check: Hypervisor
A check is a check's name in your check engine. With two check engines
that both have a check of that name, say which, as Gatus Outside/Photos;
if you don't, the dot shows the worse of the two, and the log says so once.
Overlook ships icons for a few common apps (web/icons); a file of the
same name in icons/ beside the config wins over one of them.
Chores are what you do while nothing is broken: the ones you keep on a to-do list, which the iCalendar source reads; the updates waiting for your merge, which the GitHub source reads; the updates waiting to be installed, which the Home Assistant, Nextcloud and UniFi sources read, the batteries to change, from Home Assistant, and the devices waiting to be adopted, from UniFi; and the requests waiting for your approval, which the Seerr source reads. The page lists the chores due, from their day on, and those in the coming week, by the viewer's own calendar; with none, it says which is next. With chores from more than one source, each is named by the one it waits in. You add, change and mark chores done in your to-do app or from a script, and do the others where they wait, never on the page (ADR 0010), and the page follows within 30 seconds.
Flags. -config names the config (overlook.yaml by default), and
.env, icons/ and custom.css are read beside it; -listen is the address to
serve the page on (:8080).
Adapters
Each adapter reads the sources of one program. More come by pull request from people who run them (CONTRIBUTING.md).
Gatus
A check engine: every check, its last results and the problems Gatus remembers. A check is a problem once it fails as many times in a row as your alerts wait for, and stops being one when it passes.
sources:
  gatus:
    - url: http://gatus:8080            # where Overlook reads Gatus
      link: https://status.example.com  # where the page sends you, if not the same
      threshold: 3                      # failures in a row that make a problem: as your alerts
      areas:                            # where a group not named like an area goes
        DNS: network
        Backups: storage
Key: none, as Gatus's API is open unless you protect it. If yours asks
for a login, as Gatus's security.basic does, give it as user and
password: user: overlook and password: ${GATUS_PASSWORD}.
Areas: a group named like an area, such as Servers or network, puts its
checks there. areas says where each other group goes, and a group it
doesn't name is in no area. Threshold: set it to your alerts'
failure-threshold (3 unless you changed it), so a problem on the page is
one your alerts announced.
Uptime Kuma
A check engine, as Gatus is: each monitor on one of its status pages, its last 30 results and the problems they remember. A monitor is a problem once Uptime Kuma calls it down, after the retries you gave it, which is when it alerts; while it retries, the page shows it failing.
sources:
  uptimekuma:
    - url: http://uptime-kuma:3001     # where Overlook reads Uptime Kuma
      page: homelab                    # the status page's slug, as in /status/homelab
      link: https://uptime.example.com # where the page sends you, if not the same
      areas:                           # where a group not named like an area goes
        DNS: network
Key: none, as a status page is public: Overlook reads the monitors on the
one you name, and no others. Make one for it in Status Pages, with each
monitor in a group named like an area, such as Servers or Network, or one
areas places, as Gatus's groups are. Uptime Kuma gives a monitor's results
only there and over its socket.io, after a login, which Overlook doesn't
speak.
A status page doesn't say why a monitor failed, so the page doesn't either. Nor does it say how many retries a monitor has: the page counts them from the last time the monitor went down, in the 100 results a status page keeps, and for a monitor that hasn't gone down there, it says how many times in a row it failed, but not how many make a problem. Uptime Kuma serves a status page's results a minute at a time.
Recorded from a scratch Uptime Kuma 2.5.8 with invented monitors (ADR 0008),
until someone who runs one records it from theirs: the compose file and the
scripts that fill and record it are in the adapter's
testdata.
Grafana
A check engine, as Gatus is: each alert rule Grafana manages, in the area
its folder is named after, or the one areas gives, with its last 30
evaluations and the problems its state history remembers this week. A rule
is a problem once it fires, or while its query gives no data or an error,
which Grafana alerts on too; while it's pending, the page shows it failing,
and how many evaluations its pending period holds.
sources:
  grafana:
    - url: http://grafana:3000          # where Overlook reads Grafana
      token: ${GRAFANA_TOKEN}
      link: https://grafana.example.com # where the page sends you, if not the same
      areas:                            # where a folder not named like an area goes
        Hosts: servers
Key: a service account's token, with the role Viewer, which reads alert rules and their history and changes nothing. In Administration, Users and access, Service accounts, add one with that role, then add it a token.
Grafana keeps only when a rule's state changed, not each evaluation, so the page draws each of the last 30 from those changes at the rule group's interval. Overlook reads each rule's history with a request of its own. Alert rules kept in a Prometheus or Loki data source, rather than by Grafana itself, are left out: the Prometheus adapter reads Prometheus's own.
Recorded from a scratch Grafana 13.3 with invented alert rules over its own
test data (ADR 0008), until someone who runs one records it from theirs: the
compose file and the scripts that fill and record it are in the adapter's
testdata.
Prometheus and Alertmanager
A check engine, as Gatus is: each of Prometheus's alerting rules, in the
area its group is named after, or the one areas gives, with its last 30
evaluations, from the history Prometheus keeps of its alerts, and its
problems this week. A rule is a problem while it fires; while it's pending,
the page shows it failing, and how many evaluations its for holds. With
Alertmanager read too, a rule all of whose alerts Alertmanager silences or
inhibits isn't a problem, since Alertmanager sends no alert for it: the page
shows it failing, with the silence's comment.
sources:
  prometheus:
    - url: http://prometheus:9090              # where Overlook reads Prometheus
      alertmanager: http://alertmanager:9093   # its Alertmanager, if any
      link: https://prometheus.example.com     # where the page sends you, if not the same
      areas:                                   # where a rule group not named like an area goes
        node: servers
Key: none, as Prometheus's and Alertmanager's APIs are open unless you
protect them. If yours ask for a login, as basic_auth_users in Prometheus's
web config does, give it as user and password, the same for both.
Overlook reads the rules, two range queries of the ALERTS series and
Alertmanager's alerts and silences, all with GET, which change nothing.
This week's problems are read to five minutes, which a week of firing alerts holds in a few thousand samples.
Recorded from a scratch Prometheus 3.15 and Alertmanager 0.34 with invented
alert rules over numbers of their own (ADR 0008), until someone who runs
them records it from theirs: the compose file, the rules and the scripts
that fill and record it are in the adapter's
testdata.
Checkmate
A check engine, as Gatus is: each monitor Checkmate checks, in the area its
group is named after, or the one areas gives, with its last 30 results
and the problems its incidents remember this week. A monitor is a problem
once Checkmate calls it down, when enough of the last checks in its status
window failed, which is when it alerts; until then, the page shows it
failing, and how many failures in a row make a problem, 3 at the window's
5 checks and 60%. A hardware or Docker monitor is a problem too while
Checkmate calls it breached, over a threshold you gave it: its results fail
for as long, with what crossed it.
sources:
  checkmate:
    - url: http://checkmate:52345         # where Overlook reads Checkmate
      user: overlook@example.com          # its user's email
      password: ${CHECKMATE_PASSWORD}
      link: https://checkmate.example.com # where the page sends you, if not the same
      areas:                              # where a group not named like an area goes
        DNS: network
Key: a login, as user and password, since Checkmate has no API
keys. Overlook logs in with one POST, keeps the token in memory and sends
it with each GET, logging in again when Checkmate refuses it, after the 99
days it lasts unless you changed TOKEN_TTL (ADR 0009). The least it needs
is a user of its own with the role User, which reads every monitor and
its incidents, and can pause, change or delete none. As the super admin, in
your account's Team, use Add member to make one with that role.
A monitor you paused is left out, as Checkmate neither checks it nor alerts on it. One in a maintenance window isn't a problem either, for the same reason: the page shows its last results from before the window, failing if it was failing then. Checkmate lists a hardware monitor with its newest check alone, so Overlook reads each one's last 30 with a request of its own. A published status page could be read without a login, but it doesn't say which group a monitor is in, so nothing would place its checks in an area.
Recorded from a scratch Checkmate 3.13.1 with invented monitors, and a
Capture agent 1.4.0 for its hardware monitors (ADR 0008), until someone who
runs one records it from theirs: the compose file and the scripts that fill
and record it are in the adapter's
testdata.
GitHub
The updates waiting: the open pull requests Dependabot or Renovate opened on the repositories you list. They are chores, never problems.
sources:
  github:
    - repos: [example/homelab, example/website]
      token: ${GITHUB_TOKEN} # only for private repositories
      # bots: ["dependabot[bot]", "renovate[bot]"] # whose pull requests are updates
      # url: https://github.example.com/api/v3     # a GitHub Enterprise Server's API
Key: none for public repositories. For private ones, a fine-grained token with read-only access to Pull requests on those repositories (GitHub adds Metadata itself). Without one, GitHub answers 404 for a private repository.
Overlook reads GitHub at most every 10 minutes, so an update can take that long to show. Without a token GitHub allows 60 requests an hour from your address, and each read is one request per repository: ten repositories hold, fewer if something else at your address reads GitHub without a token.
iCalendar to-do list
The chores you keep on a to-do list, read from the iCalendar file a CalDAV server gives for a GET, such as Radicale, Nextcloud or Baïkal. Edit the list in any app that syncs it, such as Reminders on an iPhone, Tasks.org with DAVx⁵ on Android, or Thunderbird, or from a script over CalDAV.
sources:
  ical:
    - url: https://dav.example.com/owner/chores/ # the list, as Radicale serves it
      user: owner                                # a login, if the server asks for one
      password: ${DAV_PASSWORD}
      # name: Chores                             # what the page calls it, if you keep more than one list
On Nextcloud or Baïkal the url is the list's CalDAV address with ?export
at the end, such as
https://cloud.example.com/remote.php/dav/calendars/owner/chores/?export.
A to-do's title is the chore and its description the note. Its due date is the day it's due from, a time counting as its day, and one with no due date is due now. One marked done or cancelled leaves the page. A to-do that comes back is your app's to move on when you mark it done, and Overlook reads only the next due date.
Key: a login that can read the list, as user and password, sent by
HTTP's basic authentication, or none if the list is open. Overlook only ever
sends it with GET (ADR 0001). The least it needs, on Radicale, is a user of
its own with only i on the list, which lets it GET the list and nothing
else. With Radicale's rights from a file ([rights] type = from_file), beside
the sections that give each user their own:
[overlook]
user: overlook
collection: owner/chores
permissions: i
Baïkal asks for Digest unless its admin page sets Basic, which Overlook needs.
Recorded from Radicale; Nextcloud and Baïkal give the same iCalendar for
?export, but haven't been recorded.
Immich
The photos, on the Apps page: what each person keeps and uploaded this week, the space they take on Immich's disk, Immich's version and whether a newer one is out, and the jobs queued. Today's figure is everyone's photos and videos, with each person's share of the room they take.
sources:
  immich:
    - url: http://immich:2283
      key: ${IMMICH_KEY}
      # name: Photos # what the page calls it, if not Immich
Key: an API key made by an admin (Account Settings, API Keys), since Immich shows everyone's photos, the queues and each person's uploads only to an admin. Give it only these six read permissions:
server.statistics: each person's photos, videos and spaceserver.storage: the disk the photos are onserver.about: Immich's versionserver.versionCheck: the newest version releasedqueue.read: the jobs queuedadminUser.read: what each person uploaded this week
What each person uploaded needs Immich 3 or later; an older one leaves it out.
Proxmox Backup Server
Each guest's newest backup in one datastore, in Storage: when it was made, its size, and whether it passed its check, named by its notes, which Proxmox VE fills with the guest's name. Today shows how many guests the last night backed up, each guest blue where it did, and the week each night's backups. The last night is the run with the most guests in the day to the newest backup, so a guest backed up by hand after it doesn't hide it.
sources:
  pbs:
    - url: https://pbs.example.com:8007
      token: overlook@pbs!overlook
      secret: ${PBS_SECRET}
      datastore: backups
      ca: /etc/overlook/pbs.pem         # PBS's own certificate, copied from the server
      # server_name: pbs.example.com    # the name it's for, if the url uses another
Key: an API token with the role DatastoreAudit on that datastore, which lists the backups and can't read them. A token can do no more than its user, so both get the role. On the server:
proxmox-backup-manager user create overlook@pbs
proxmox-backup-manager acl update /datastore/backups DatastoreAudit --auth-id overlook@pbs
proxmox-backup-manager user generate-token overlook@pbs overlook
proxmox-backup-manager acl update /datastore/backups DatastoreAudit --auth-id 'overlook@pbs!overlook'
The third command prints the token's secret.
Certificate: PBS signs its own, for its own name. Copy
/etc/proxmox-backup/proxy.pem from the server beside Overlook and name it
as ca. If the url reaches PBS by an address its certificate doesn't
name, give the name it does as server_name. As for Proxmox VE, there is
no way to skip the check.
Proxmox VE
Each host's processor, memory, uptime and version, the guests, the storage, the ZFS pools and the last backup run, in Servers, with each host's processor and memory by the hour over the week Proxmox keeps, a line each. Today shows how many guests are up, and the week each backup run.
sources:
  proxmox:
    - url: https://pve.example.com:8006 # any host of a cluster reads all of it
      token: overlook@pve!overlook
      secret: ${PROXMOX_SECRET}
      ca: /etc/overlook/pve-root-ca.pem  # Proxmox's own CA, copied from the host
Key: an API token of a user with the role PVEAuditor, which reads everything and changes nothing. On the host:
pveum user add overlook@pve
pveum acl modify / --users overlook@pve --roles PVEAuditor
pveum user token add overlook@pve overlook --privsep 0
The last command prints the token's secret. The user has no password, so the token is the only way in, and it can do no more than the user.
Certificate: Proxmox signs its own. Copy /etc/pve/pve-root-ca.pem from
the host beside Overlook and name it as ca: Overlook then trusts that CA
alone for this source. There is no way to skip the check, since a key sent
to whoever answers in Proxmox's place is given away. A host with a
certificate from a public CA, such as Let's Encrypt, needs no ca.
Radarr
The films on disk and the room they take, the films added this week, what Radarr is downloading and warns about, and the films out to stream or on disc in the next seven days. Its home area is Apps. With Sonarr read too, the films and shows share one tile in Today, the library, split by the room each takes.
sources:
  radarr:
    - url: http://radarr:7878 # where Overlook reads Radarr
      key: ${RADARR_KEY}
      name: Radarr            # if you run more than one, tell them apart
Key: Radarr's API key, from Settings, General. It's the only key Radarr has, and it can do anything, but Overlook sends it only with GET requests, which change nothing (ADR 0001).
Radarr answers with every film at once, so Overlook reads the films at most every 10 minutes, and a film can take that long to count. The rest is read with every snapshot.
Sonarr
The shows and episodes on disk and the room they take, the episodes imported this week, what Sonarr is downloading and warns about, and the episodes that air in the next seven days. Its home area is Apps. With Radarr read too, its shows share the library's tile with the films.
sources:
  sonarr:
    - url: http://sonarr:8989 # where Overlook reads Sonarr
      key: ${SONARR_KEY}
      name: Sonarr            # if you run more than one, tell them apart
Key: Sonarr's API key, from Settings, General. Like Radarr's, it's the only key and it can do anything, and Overlook sends it only with GET requests (ADR 0001).
The shows are read at most every 10 minutes, as Radarr's films are.
NUT
A UPS, read from NUT's upsd over NUT's own protocol. Servers shows whether it runs on mains or on its battery, its model and the voltage it's fed, the battery's charge and how long it would last, and what its load draws; the overview shows the draw and the battery.
sources:
  nut:
    - host: nut.example.com # upsd, as host or host:port (3493 unless you say)
      ups: ups              # the UPS's name in upsd, as in its ups.conf
upsd needs no login for this: Overlook sends only LIST VAR for the UPS
named, and has no code to send any other command.
upsd must listen where Overlook can reach it, which by default it doesn't:
set MODE=netserver in nut.conf, add a LISTEN line for the address
Overlook reaches to upsd.conf (such as LISTEN 192.0.2.13 3493), and let
Overlook through any firewall to that port. The readings cross the network
unencrypted, as upsd sends them without TLS.
UniFi Network
Each UniFi OS console, such as a Cloud Gateway, a Dream Machine or UniFi OS Server, and every site on it, in Network. First the internet: each WAN, how long it has been up, how much of the last day it answered and how fast, or since when it's down, and the last speed test. A WAN down since the gateway started, as a spare port with nothing in it is, is grey while another is up; one that drops is red. Then each device, the gateway, switches and access points: how long it has been up and how busy its processor and how full its memory are, or its state, offline in red and interrupted in orange. Today shows the clients connected, wired, wireless and on the VPN, every console's added up, in orange while a device or a WAN is down. A device offline isn't a problem, since Overlook runs no check: give it a check in your check engine to make it one. The chores are each device whose firmware waits, a gateway's being UniFi OS itself, each device waiting to be adopted, and the Network application's update.
sources:
  unifi:
    - url: https://unifi.example.com
      key: ${UNIFI_KEY}
      ca: /etc/overlook/unifi.pem    # the console's own certificate
      server_name: unifi.local       # the name it's for
Key: an API key, from the Network application's Integrations: Create New API Key, with Never Expires. UniFi has no read-only key, so it could change anything on the console, every site and device; what keeps it harmless is that Overlook only ever sends GET (ADR 0001). It needs UniFi OS and Network 10.0 or later.
Certificate: the console signs its own, for unifi.local, and Overlook
never reads a source it can't check. Save it with
openssl s_client -connect unifi.example.com:443 </dev/null | openssl x509 >unifi.pem,
give it as ca and name unifi.local as server_name. When the console
makes a new one, every two years or so, save it again. With a certificate
of your own on the console, you need neither.
Two reads nothing documents. UniFi's documented API says nothing of the WANs or of the Network application's update, so Overlook reads them from the API before it, with the same key and a GET too. Ubiquiti changes that one without warning: when a change breaks a read, the Internet section or that chore goes missing, and the rest stays, until the adapter is recorded again. UniFi's history isn't read: its events come only from a POST, and its traffic by the hour from a read that Network 11 has only just moved.
Recorded from the maintainer's Cloud Gateway Fiber, on UniFi OS 5.1.34 with
Network 10.6.109, with every name, ID and MAC address made up; its
record.sh records yours.
AdGuard Home
Each resolver is its own source. Today's lookups and blocks show on the Overview, every resolver's added up, hour by hour. The Network page charts them by the hour over the hours every resolver keeps, added up too, then shows each one: whether it blocks, its lookups, blocks and upstreams, how fast it answers and its version, and its top clients, domains and blocked domains, over the interval its statistics keep. The Overview's lookups turn orange while a resolver doesn't block.
sources:
  adguard:
    - name: Primary DNS
      url: http://dns1.example.com
      user: overlook
      password: ${ADGUARD_PASSWORD}
    - name: Standby DNS
      url: http://dns2.example.com
      user: overlook
      password: ${ADGUARD_PASSWORD}
Key: a login, as user and password. AdGuard Home has no
read-only users, so that login could change anything; what keeps it
harmless is that Overlook only ever sends GET (ADR 0001). Give Overlook a
user of its own: add it under users: in AdGuardHome.yaml, with its
password hashed by htpasswd -B -C 10 -n -b overlook <password>, and
restart AdGuard Home.
Today starts at midnight in Overlook's time zone: set TZ, such as
TZ=Europe/Brussels, in its container. AdGuard Home keeps statistics by
the hour for an interval of up to 7 days; over a longer one it keeps them
by the day, in UTC, and the Overview shows no figure for it.
Pi-hole
A resolver, as AdGuard Home is: each one is its own source, and its lookups add up with every other resolver's, AdGuard Home's too, on the Overview and in the Network page's chart, hour by hour over the last day, which is all Pi-hole keeps in memory, so beside a resolver that keeps a week, the chart shows the day they both have. Then each one, as any resolver: whether it blocks, or is paused and until when, its lookups, blocks and upstreams; then its blocklists and when they were last updated, what it warns about, such as a client it rate-limits, its version and whether a newer one is out; and its top clients, domains and blocked domains.
sources:
  pihole:
    - name: Kids' DNS
      url: http://pihole.example.com
      password: ${PIHOLE_PASSWORD}
Key: an app password, from Settings, Web interface / API, in expert
mode: Configure app password. Pi-hole gives a session only for a login,
so Overlook logs in with one POST, keeps the session in memory and sends it
with each GET, logging in again only when Pi-hole forgets it (ADR 0009). An
app password logs in without the second factor, if you set one, and Pi-hole
has no read-only one, so it could change anything; what keeps it harmless is
that Overlook sends nothing else. With no password set in Pi-hole, leave
password out. Each Overlook keeps one of the sessions Pi-hole allows, 16
unless you changed webserver.api.max_sessions.
Recorded from a scratch Pi-hole 2026.10 with invented clients and domains
(ADR 0008), until someone who runs one records it from theirs: the compose
file and the scripts that fill and record it are in the adapter's
testdata.
Beszel
Each system Beszel's agents report on, as a host, in Servers: how long it has been up, its threads and load, and how busy its processor and how full its memory and disk are, or since when it's down. Its processor and memory by the hour, over the week Beszel keeps, are a line each on the same charts as any other source's hosts, such as Proxmox's. Today shows the hosts up, every hub's added up.
sources:
  beszel:
    - url: http://beszel:8090         # where Overlook reads the hub
      user: overlook@example.com      # its user's email
      password: ${BESZEL_PASSWORD}
Key: a login, as user and password, since Beszel has no API keys.
Overlook logs in with one POST, keeps the session in memory and sends it
with each GET, logging in again when Beszel forgets it (ADR 0009). The least
it needs is a user of its own with the role readonly, which can change
nothing, nor read the agents' keys. As a superuser, in the hub's admin page
at /_/, add the user to the users collection with role set to
readonly, then add it to the users of each system to show, or set
SHARE_ALL_SYSTEMS=true on the hub so that every user sees every system.
Docker
Each container a Docker engine runs, in Servers: its image, and whether it runs, those that exited with an error, restart or fail their health check in red or orange, and one that exited cleanly, as a job does when it's done, in grey. Today shows the containers running, every engine's added up.
sources:
  docker:
    - url: http://socket-proxy:2375 # Docker's API, through a socket proxy
      name: Media                   # if you run more than one engine, tell them apart
Key: none, as Docker's API has no login and no read-only access: whoever reaches its socket is root on the host, even through a socket mounted read-only. So Overlook reads it only through a socket proxy that lets the containers' reads through and refuses the rest, over HTTP: it has no way to read Docker's socket itself, nor Docker's API over TLS. With linuxserver's socket proxy, beside the containers on each host:
services:
  socket-proxy:
    image: lscr.io/linuxserver/socket-proxy:3.4.7
    environment:
      CONTAINERS: "1" # the containers' reads; every write stays refused
    volumes: ["/var/run/docker.sock:/var/run/docker.sock:ro"]
    read_only: true
    tmpfs: [/run]
    ports: ["2375:2375"] # where Overlook reaches it: keep it from anyone else
Overlook reads only the list of containers, never a container's own details, which hold its environment and so its keys.
Prowlarr
Each indexer, on the Apps page: whether it's enabled, those Prowlarr leaves out because they fail, in red with since when, and what each was asked and grabbed this week; and what Prowlarr warns about.
sources:
  prowlarr:
    - url: http://prowlarr:9696 # where Overlook reads Prowlarr
      key: ${PROWLARR_KEY}
Key: Prowlarr's API key, from Settings, General. Like Radarr's, it's the only key and it can do anything, even read each indexer's own key, and Overlook sends it only with GET requests (ADR 0001).
qBittorrent
The torrents, on the Apps page: how many download and seed and how fast, the room left on qBittorrent's disk, whether peers can reach it, and each torrent in error, with where it's saved. Today shows the torrents downloading, every qBittorrent's added up.
sources:
  qbittorrent:
    - url: http://qbittorrent:8080 # where Overlook reads its web UI
      key: ${QBITTORRENT_KEY}
Key: from qBittorrent 5.2, an API key, from Options, WebUI. It can do
anything the web UI can, and Overlook sends it only with GET requests
(ADR 0001). Before 5.2 there are no keys: give the web UI's login as user
and password instead, and Overlook logs in with one POST, keeps the
session in memory and sends it with each GET, logging in again only when
qBittorrent forgets it (ADR 0009). A wrong password is tried once a read,
so qBittorrent bans Overlook's address after five, for an hour unless you
changed it. With neither, qBittorrent must let Overlook in without a login,
as its bypass for whitelisted subnets does for Overlook's address.
The list of every torrent, which gives the counts and the room left, is megabytes for a thousand torrents, so Overlook reads it at most every 10 minutes. The speeds, the connection and the torrents in error are read with every snapshot.
Jellyfin
The films, shows and music, on the Apps page: what each person plays now and how, as it is, transcoded or paused; how many films, shows, albums and books there are; the room left on each disk the libraries are on; the failed logins of the last day; and each task whose last run failed, such as a library's scan, in red with why. Today shows the plays since midnight, hour by hour, every Jellyfin's added up.
sources:
  jellyfin:
    - url: http://jellyfin:8096 # where Overlook reads Jellyfin
      key: ${JELLYFIN_KEY}
Key: an API key, from the dashboard's API Keys. It's the only kind Jellyfin makes, and it can do anything an administrator can, but Overlook sends it only with GET requests, which change nothing (ADR 0001).
Recorded from a scratch Jellyfin 12.4 filled with invented films and people
(ADR 0008), until someone who runs one records it from theirs: the compose
file and the scripts that fill and record it are in the adapter's
testdata.
Emby
The films, shows and music, on the Apps page: what each person plays now and how, as it is, transcoded or paused; how many films, shows, albums and books there are; the failed logins of the last day; and each task whose last run failed, such as a library's scan, in red with why. Today shows the plays since midnight, hour by hour, every media server's added up.
sources:
  emby:
    - url: http://emby:8096 # where Overlook reads Emby
      key: ${EMBY_KEY}
Key: an API key, from the dashboard's Advanced section, API Keys. It's the only kind Emby makes, and it can do anything an administrator can, but Overlook sends it only with GET requests, which change nothing (ADR 0001).
Recorded from a scratch Emby 4.10 filled with invented films and people
(ADR 0008): the compose file and the scripts that fill and record it are in
the adapter's testdata.
Plex, through Tautulli
Plex, on the Apps page, as Tautulli watches it: what each person plays now and how, as it is, transcoded or paused, and the bandwidth it takes, of it to remote players; each library, by what it holds; whether a newer Plex is out, when Tautulli knows; and, in red, a Plex server Tautulli can't reach. Today shows the plays since midnight, hour by hour, every media server's added up, Jellyfin's and Emby's too.
sources:
  tautulli:
    - url: http://tautulli:8181 # where Overlook reads Tautulli, directly
      key: ${TAUTULLI_KEY}
      # name: Plex              # what the page calls it, if not Plex
Key: Tautulli's API key, from Settings, Web Interface, with the API on.
It's the only key Tautulli has, and it can change Tautulli even through a
GET: every command of Tautulli's API is one, such as
delete_all_history, so the GET-only client can't keep this key harmless.
What does is that the adapter sends only five commands, each of which
reads, from one list in its code that its test checks (ADR 0011). Tautulli
takes the key only in the address, so a proxy in front of it may log the
key: let Overlook reach Tautulli directly, as above.
Recorded from a scratch Tautulli 2.18 watching a scratch Plex 1.43, with
invented films and plays (ADR 0008), until someone who runs one records it
from theirs: the compose file and the scripts that fill and record it are
in the adapter's testdata.
Seerr
The requests for films and shows, on the Apps page: how many wait for your approval, how many are on their way and how many are there, the problems people reported that are still open, in orange, and whether a newer Seerr is out or it waits for a restart. Each request waiting for approval is a chore, from the day it was made, by its title and who asked, a link to its page in Seerr, where you approve or decline it.
sources:
  seerr:
    - url: http://seerr:5055             # where Overlook reads Seerr
      key: ${SEERR_KEY}
      link: https://requests.example.com # where the page sends you, if not the same
Key: Seerr's API key, from Settings, General. It's the only key Seerr has, and it can do anything an administrator can, approving requests too, but Overlook sends it only with GET requests, which change nothing (ADR 0001).
A request names its film only by its number on TMDB, so Overlook reads each title once from Seerr and keeps it, a title never changing; the 20 newest requests waiting are listed.
Recorded from a scratch Seerr 3.5 with invented people asking for
public-domain films (ADR 0008), until someone who runs one records it from
theirs: the compose file and the scripts that fill and record it are in the
adapter's testdata.
Home Assistant
The home, on the Apps page: Home Assistant's version, or whether it started in safe or recovery mode; its automations, those that ran today and those whose config it couldn't load, which never run, in red; and each device that dropped off, the newest first. The updates it waits to install are chores, each a link to its page of updates, as are the batteries below 20%.
sources:
  homeassistant:
    - url: http://homeassistant:8123   # where Overlook reads Home Assistant
      token: ${HOMEASSISTANT_TOKEN}
      link: https://home.example.com   # where the page sends you, if not the same
Key: a long-lived access token of a user of Overlook's own that isn't an
administrator. As an administrator, add the user in Settings, People, Users,
with Administrator off; then log in as it, and make the token in its
profile's Security tab. A user that isn't an administrator can still use
every device, such as unlocking a door, with a POST, but Overlook sends only
GET requests, which change nothing (ADR 0001). It reads /api/config and
/api/states, which default_config turns on.
Paperless-ngx
The documents, on the Apps page: how many Paperless-ngx keeps and how many wait in its inbox, the room left on its disk, each part it runs on that isn't well, such as its search index or its task queue, as it words why, and each document it failed to take in, in red with why, until it's dismissed in Paperless-ngx. Today shows the documents and the inbox.
sources:
  paperless:
    - url: http://paperless:8000 # where Overlook reads Paperless-ngx
      token: ${PAPERLESS_TOKEN}
Key: the API token of a user of Overlook's own, which sees no document.
Paperless-ngx shows the parts' health and everyone's failed tasks only to
staff, so as a superuser, in Settings, Users & Groups, add a user with
Admin on and Superuser off, and give it only two permissions: View
on tasks and View on global statistics (view_paperlesstask and
view_global_statistics). Then make its token, as the user, from its
profile, or with
curl -X POST -d username=overlook -d password=… https://paperless.example.com/api/token/.
It can see no document and change nothing, and Overlook sends it only with
GET requests.
Overlook asks for the API's version 10, so that a newer Paperless-ngx answers
it the same way.
Recorded from a scratch Paperless-ngx 3.3.4 filled with invented letters
(ADR 0008), until someone who runs one records it from theirs: the compose
file and the scripts that fill and record it are in the adapter's
testdata.
Nextcloud
The files, on the Apps page, from Nextcloud's serverinfo app: how many files there are, of how many people, and how many used Nextcloud since yesterday; the shares, by link and without a password; the room left and the database's size; and its version, whether a newer one is out, or, in red, whether it's in maintenance. Each app waiting for an update is a chore, a link to Nextcloud's page of updates. Today shows the files, and who used it.
sources:
  nextcloud:
    - url: http://nextcloud             # where Overlook reads Nextcloud
      token: ${NEXTCLOUD_TOKEN}
      link: https://cloud.example.com   # where the page sends you, if not the same
Key: serverinfo's own token, which reads serverinfo's answer and nothing
else, not even a file. Serverinfo ships with Nextcloud; set its token with
occ, as Nextcloud's own user:
occ config:app:set serverinfo token --value "$(openssl rand -hex 24)"
occ config:app:get serverinfo token
The counts are Nextcloud's background jobs', so they move as often as its cron runs, every five minutes if you set it up so.
Recorded from a scratch Nextcloud 35.0.2 with invented people and files
(ADR 0008), until someone who runs one records it from theirs: the compose
file and the scripts that fill and record it are in the adapter's
testdata.
Can't be read
These tools can't be read the way Overlook reads, with GET (ADR 0001), one login (ADR 0009) and, for a source that changes things on GET, a fixed list of reads (ADR 0011), or are left out on purpose. Each names the decision it runs into, and none gets an adapter until that changes:
- Backrest and restic: restic has no API, every call to Backrest's is a POST, and its metrics say how the last backup went, not when (ADR 0001).
- Caddy, on purpose: its admin API has no login, and its only lock is a TLS client certificate, so opening it to Overlook opens it to anyone there to rewrite Caddy's config (ADR 0001).
- Deluge, Transmission, Komodo and Zabbix: every read is a POST (ADR 0001).
- Dockge: it speaks only socket.io (ADR 0001).
- Plex on its own, on purpose: its token is your whole Plex account, other servers and friends too, so Overlook reads Plex through Tautulli (ADR 0011).
- Synology DSM: its only documented login is a GET with the password in the address, where logs keep it, and how to read its health isn't documented (ADR 0009).
- TrueNAS: TrueNAS 27 removes the REST API, which leaves only a WebSocket (ADR 0001).
- Unbound: its statistics come only from
unbound-control, over TLS with a client certificate, or on the same machine (ADR 0001). - Vaultwarden, on purpose: reading more than its version takes the admin token, which can delete every user (ADR 0009).
Others are left out for a reason of their own:
- Dozzle and Authelia: they show nothing more than whether they answer, which a check already says.
- Readarr: retired in June 2025.
- The UniFi Network application on its own, without UniFi OS: it has no API keys, and Ubiquiti dropped it in Network 11, for UniFi OS Server, which UniFi reads.
- Watchtower: no longer kept, and archived in December 2025.
No login
Overlook has no accounts and no login: anyone who can open the page sees all of it. It never shows a key, but it does show your hosts, names and what is wrong. Keep it on your LAN or behind your VPN, or put it behind your reverse proxy's own authentication, such as forward auth to your identity provider.
Your own look
A custom.css beside the config is loaded after the page's own
stylesheet, so it can change any colour, size or font:
/* overlook/custom.css */
:root {
  --m-accent-2: #3cad4b;   /* the accent, green */
  --m-content-max: 1400px; /* a wider page */
}
The page's colours, sizes and fonts are the --m- properties at the top
of web/style.css. The page stays one page: custom.css
changes how it looks, not what it shows.
Translating
The page speaks the language of your browser when someone has translated it, and English for any word a translation lacks. A translation is one file; CONTRIBUTING.md says how.
What's next
v0.5.0 is the newest release, and the releases
say what each one brought. The road to v0.6 is written from what people
ask for, and goes here. Until then, the
adapters wanted
are open as issues: if you run one of them, its issue says what an
adapter for it takes.
Contributing
CONTRIBUTING.md says how to set up, what every change passes, how to add an adapter and how Overlook is written. The words the project uses are in CONTEXT.md and its decisions in docs/adr. Ask a question in Discussions, and report a vulnerability privately, as SECURITY.md explains. Everyone who takes part keeps to the code of conduct.
Licence
Overlook is under the MIT licence. The page ships the Inter
font, under the SIL Open Font License (web/fonts), and logos
of common apps, under the Apache License 2.0 but for UniFi's, which is
Ubiquiti's own, and Checkmate's, adapted from Cburnett's chess set under
CC BY-SA 3.0 (web/icons), each logo its owner's trademark.
Media gallery
Categories
Related apps
Explore more like this
Explore allDetails
ghcr.io/bnlqn/overlook:latestRuntime arguments
- Web UI
http://[IP]:[PORT:8080]/- Network
bridge- Privileged
- false
- Extra Params
--read-only --cap-drop=ALL --security-opt=no-new-privileges
Template configuration
The port the page is served on.
- Target
- 8080
- Default
- 8080
- Value
- 8080
The folder that holds overlook.yaml and the .env with its keys, mounted read-only. Empty at first: the setup page hands back both files to save here.
- Target
- /etc/overlook
- Default
- /mnt/user/appdata/overlook
- Value
- /mnt/user/appdata/overlook