
All apps · 0 apps
nas-doctor
Docker app from mcdays94's Repository
Overview
NAS Doctor is a local diagnostic and monitoring tool for your NAS. It runs periodic health checks — analyzing SMART data, disk usage, Docker containers, GPU, network, kernel logs, temperatures, ZFS pools, UPS power, and Unraid parity — then presents findings in a beautiful web dashboard with actionable recommendations backed by Backblaze failure rate data.
Features:
- 20+ diagnostic rules with automatic root-cause correlation
- SMART health with Backblaze failure-rate thresholds (337k+ drives)
- Top Processes with Docker container attribution (cgroup matching)
- Historical trend sparklines (CPU, memory, I/O, drive temps)
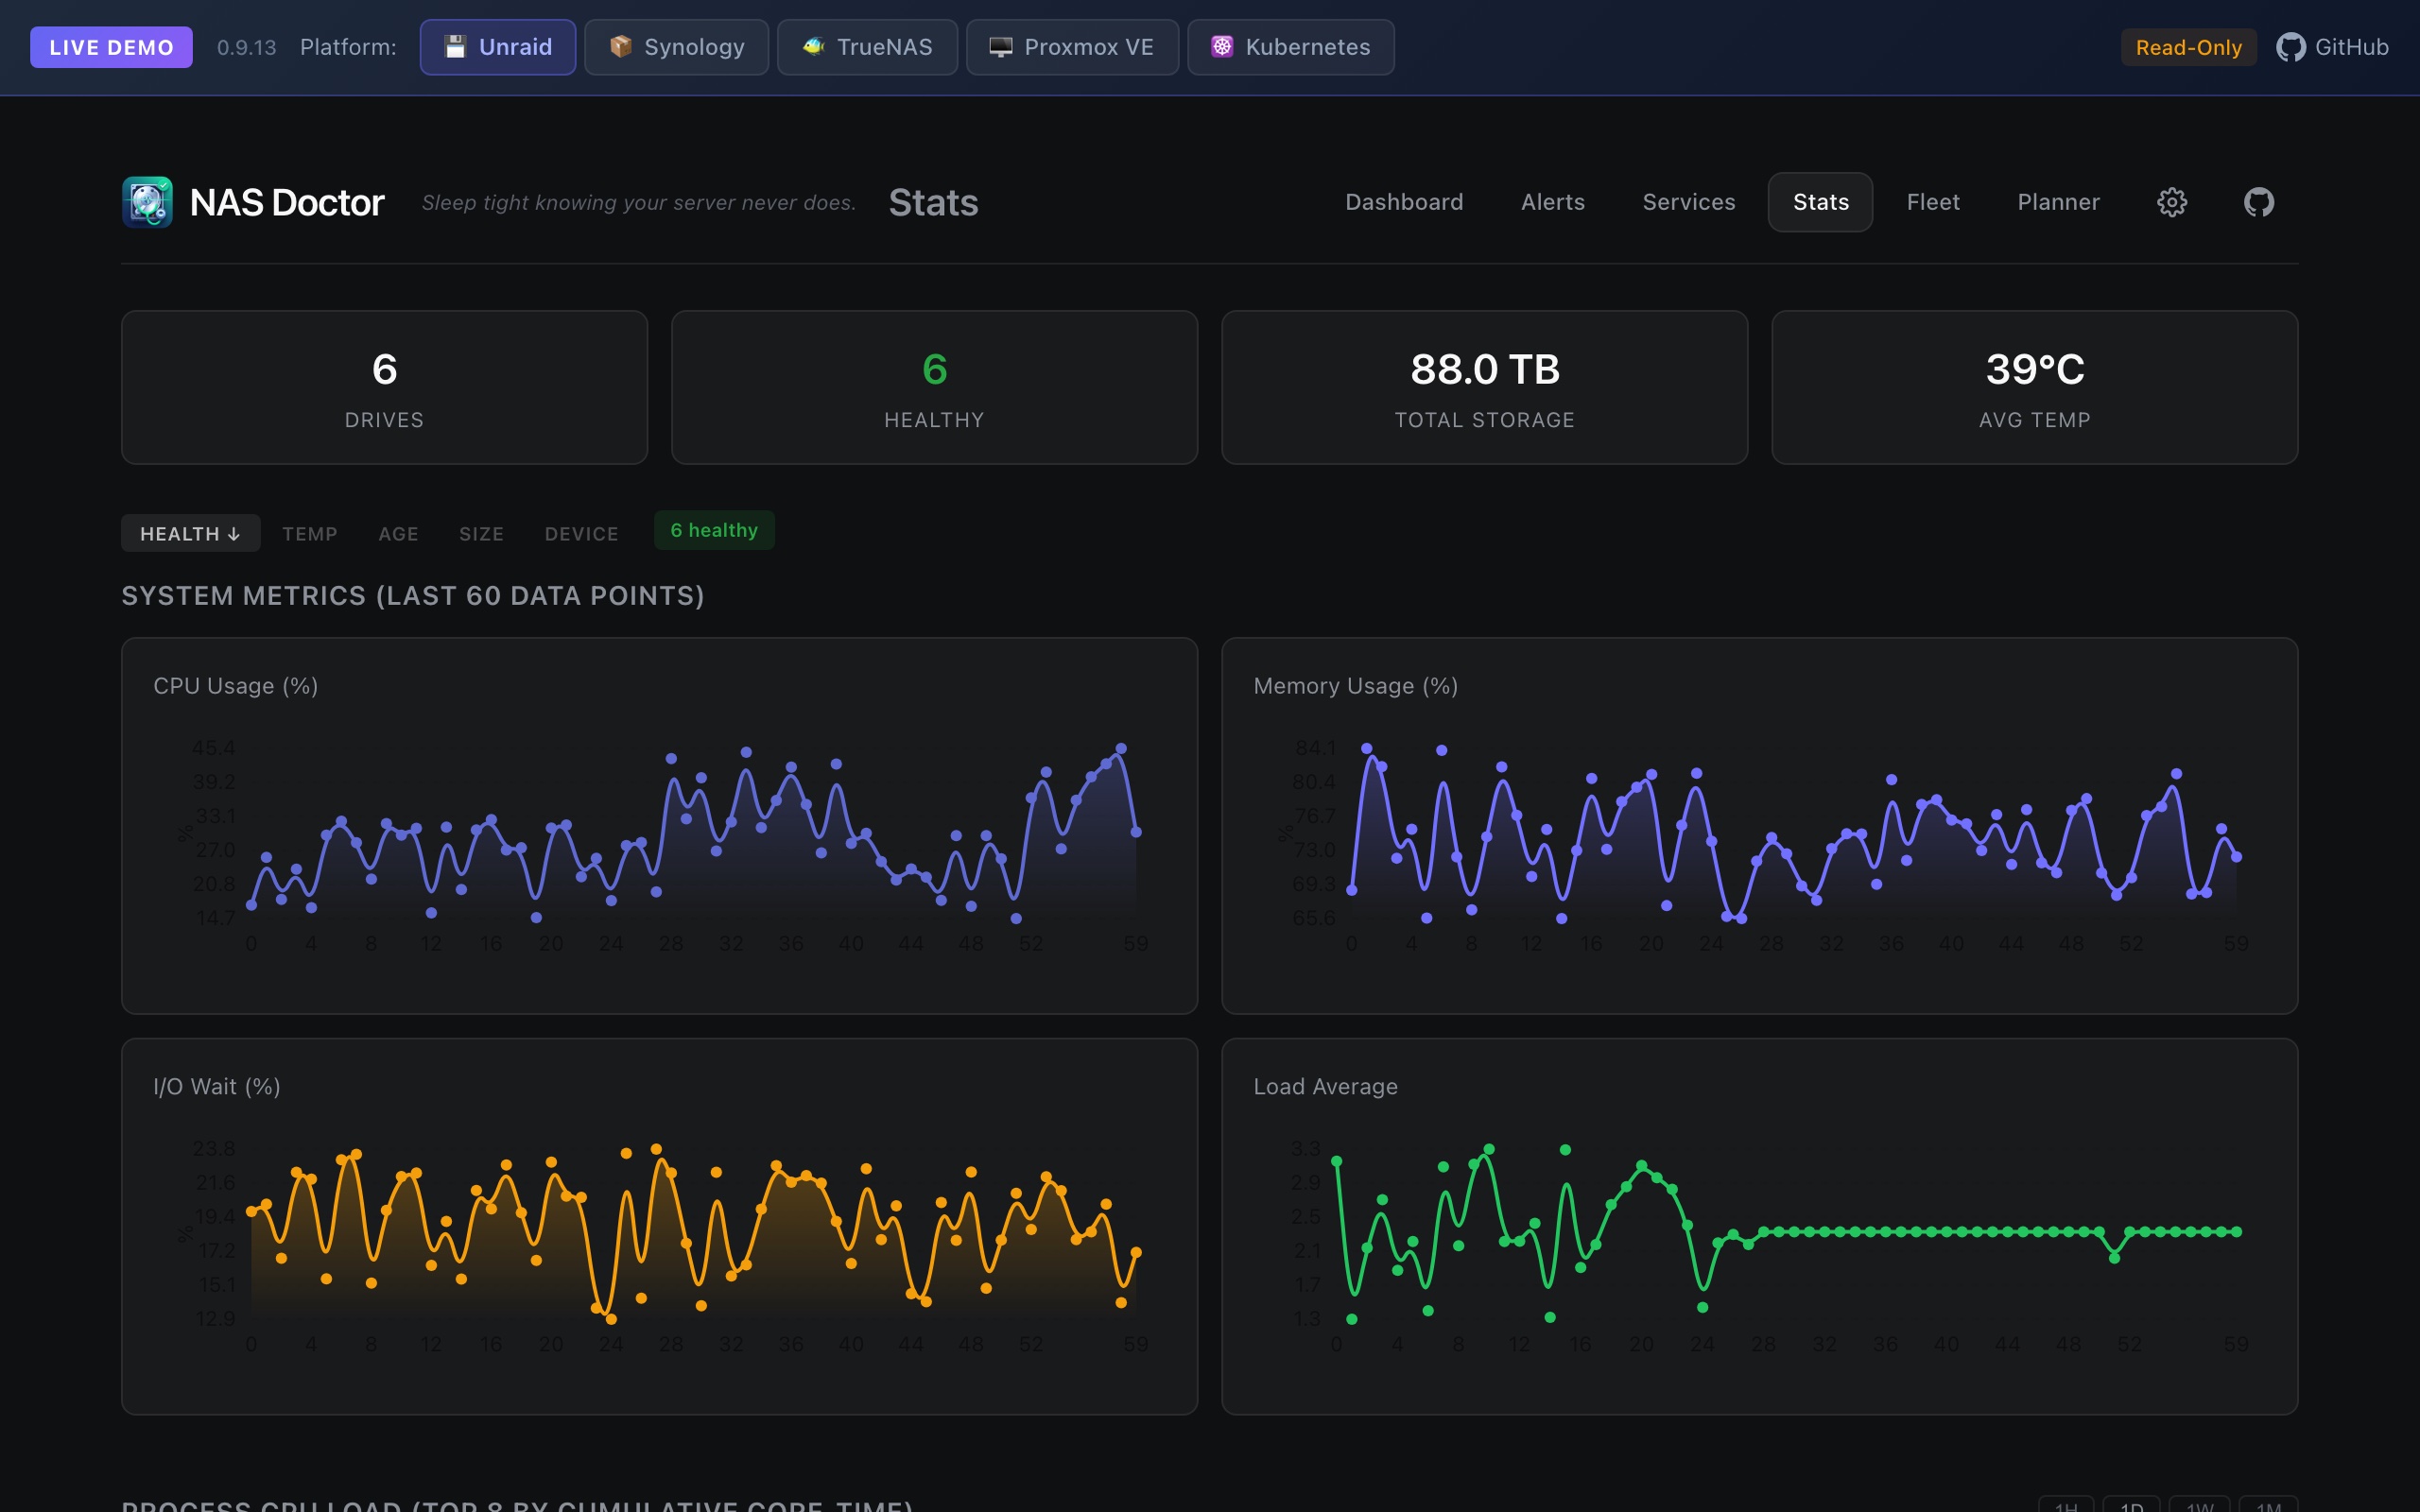
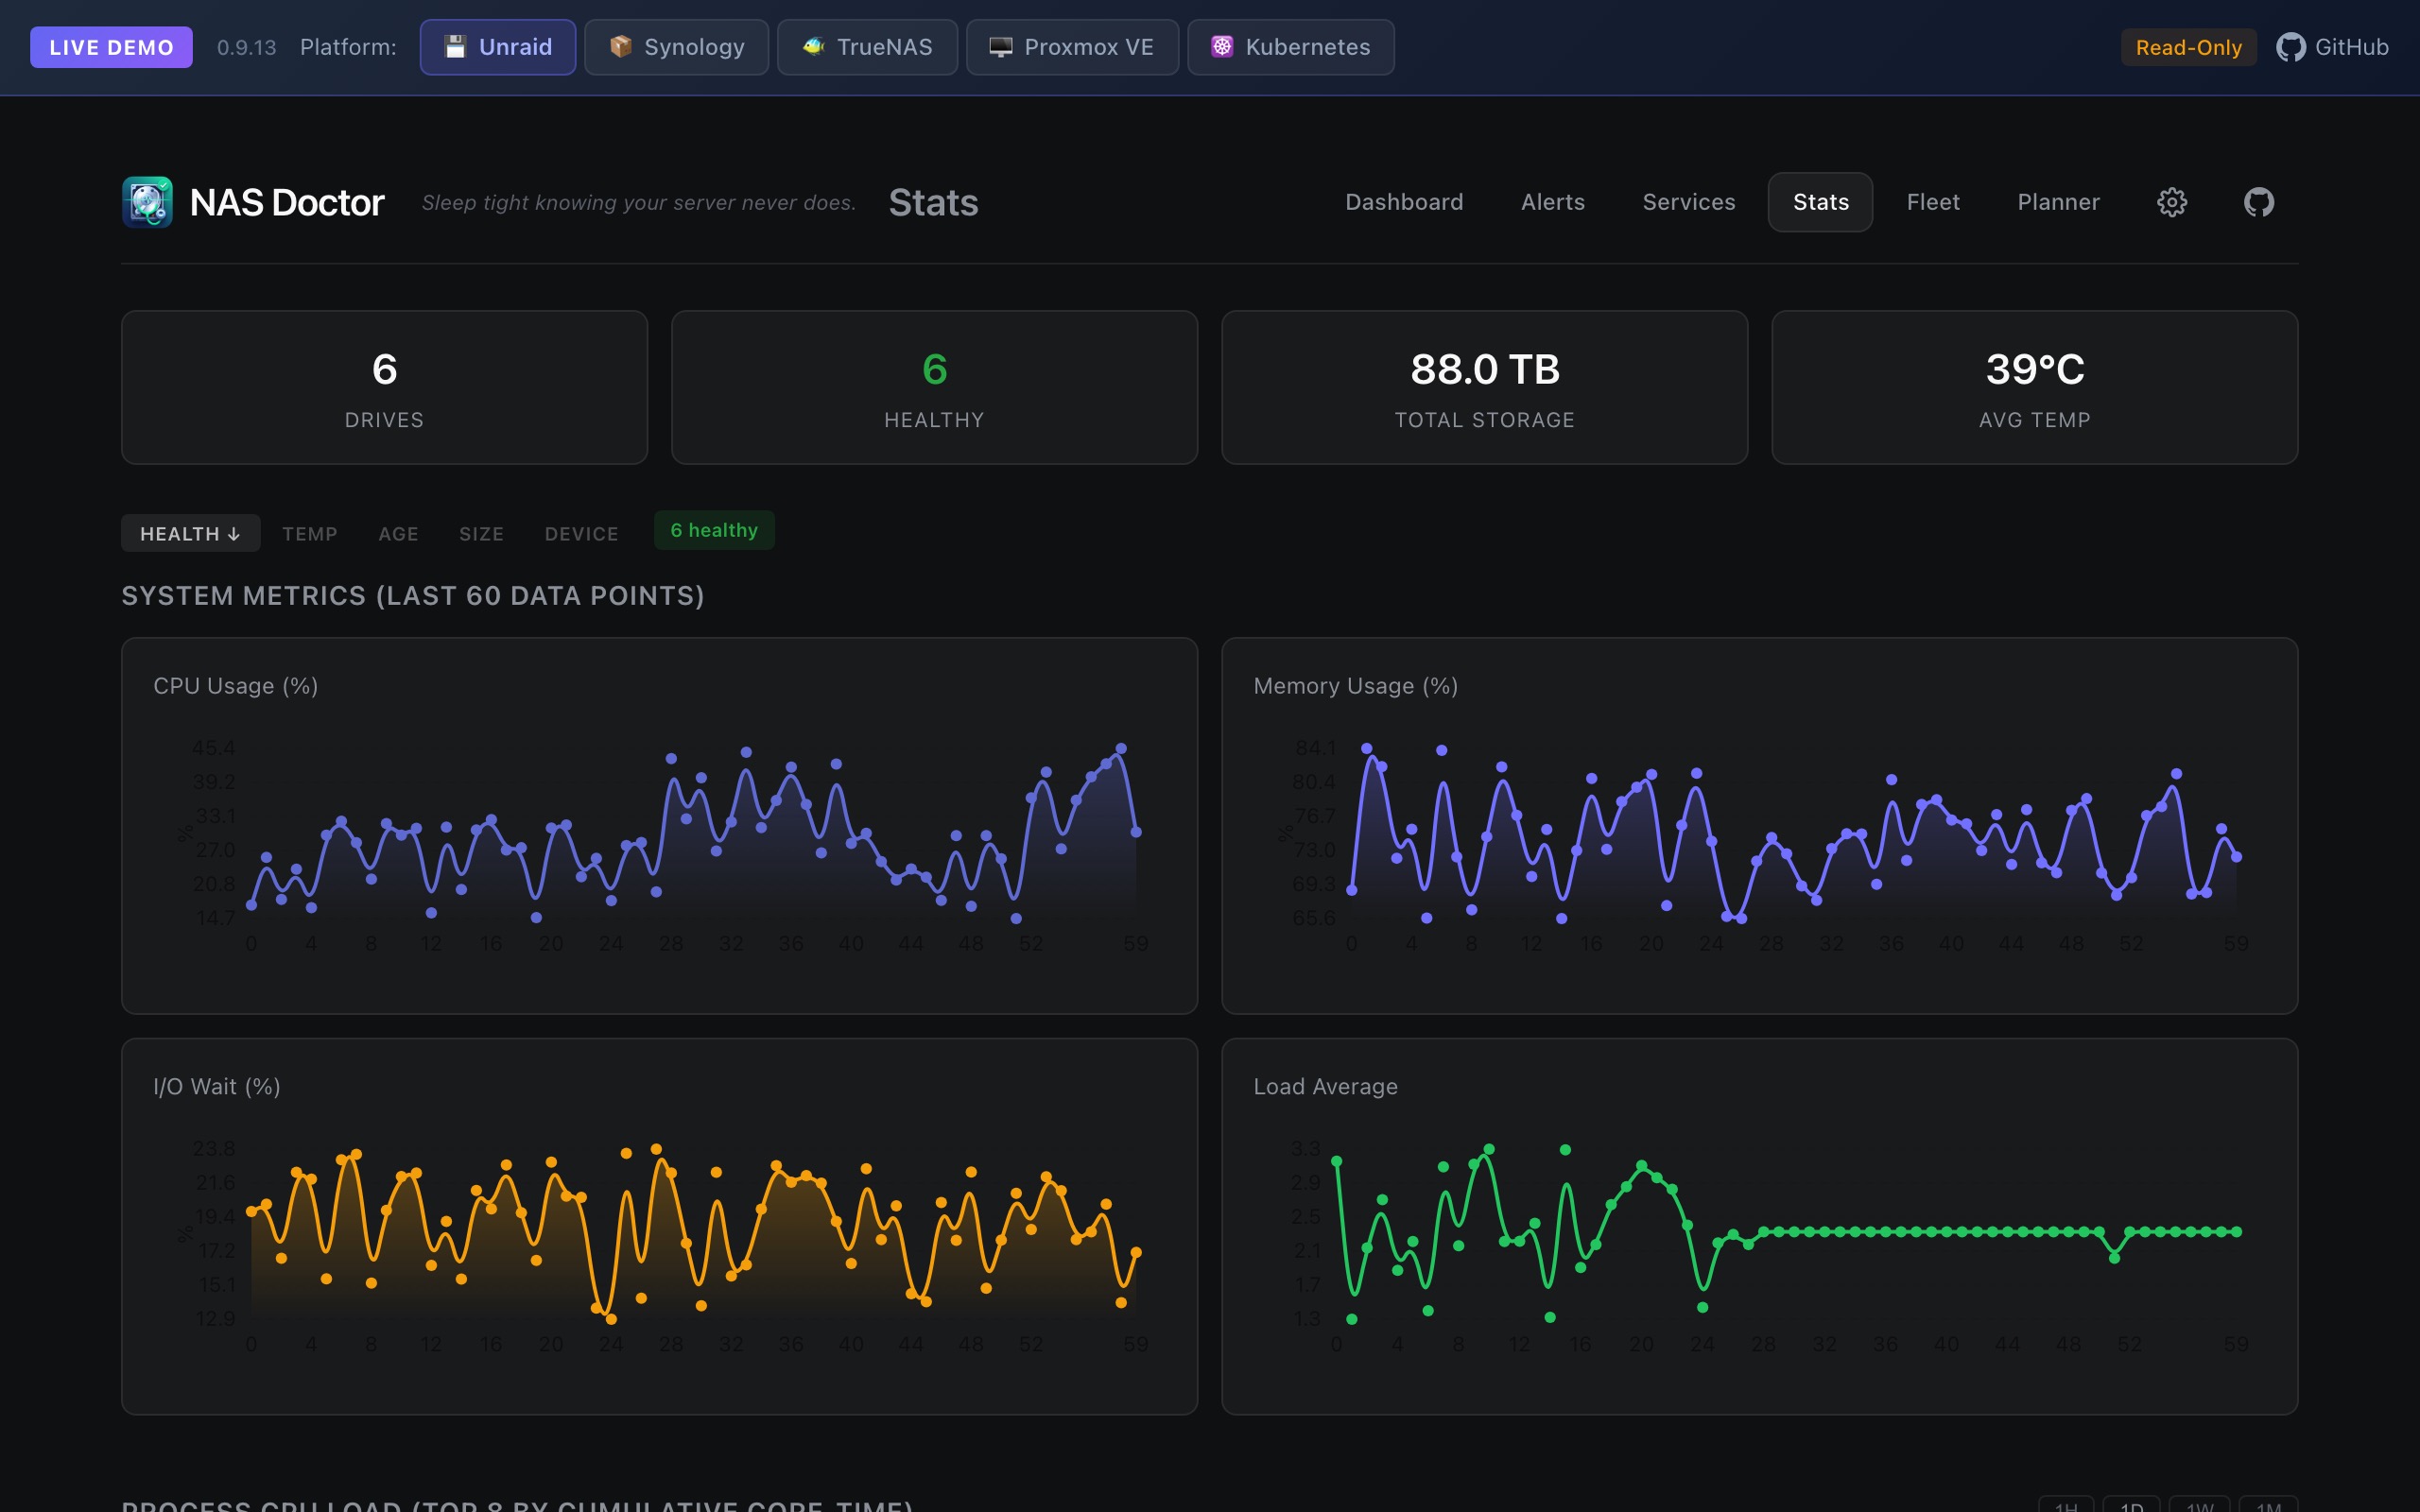
- Full stats page with trend charts and process CPU history
- GPU monitoring (NVIDIA, Intel, AMD)
- Speed test scheduling (Ookla CLI)
- ZFS pool health (vdev tree, scrub/resilver, ARC stats)
- UPS / power monitoring (NUT and apcupsd)
- NAS OS update check (notifies when behind latest stable)
- Parity check speed trend analysis (Unraid)
- 2 dashboard themes (Midnight and Clean)
- Export professional PDF diagnostic reports
- Multi-server fleet monitoring (monitor all your NAS instances)
- Prometheus /metrics endpoint (120+ gauges)
- Webhook alerts: Discord, Slack, Gotify, Ntfy, generic HTTP
- Automatic backups with configurable schedule and location
- Data lifecycle management (retention policies, DB size cap)
- Dashboard section visibility toggles and multi-column layout
Readme
View on GitHub
NAS Doctor
Sleep tight knowing your server never does.
Local NAS diagnostic and monitoring tool.
Run it as a Docker container on your Unraid, TrueNAS, Synology, Proxmox, or Kubernetes cluster.
Beautiful dashboards, Prometheus metrics, webhook alerts — no cloud account required.
Beta — NAS Doctor is in active development. Core features are stable and tested on Unraid. Other platforms may have edge cases. Report issues here.


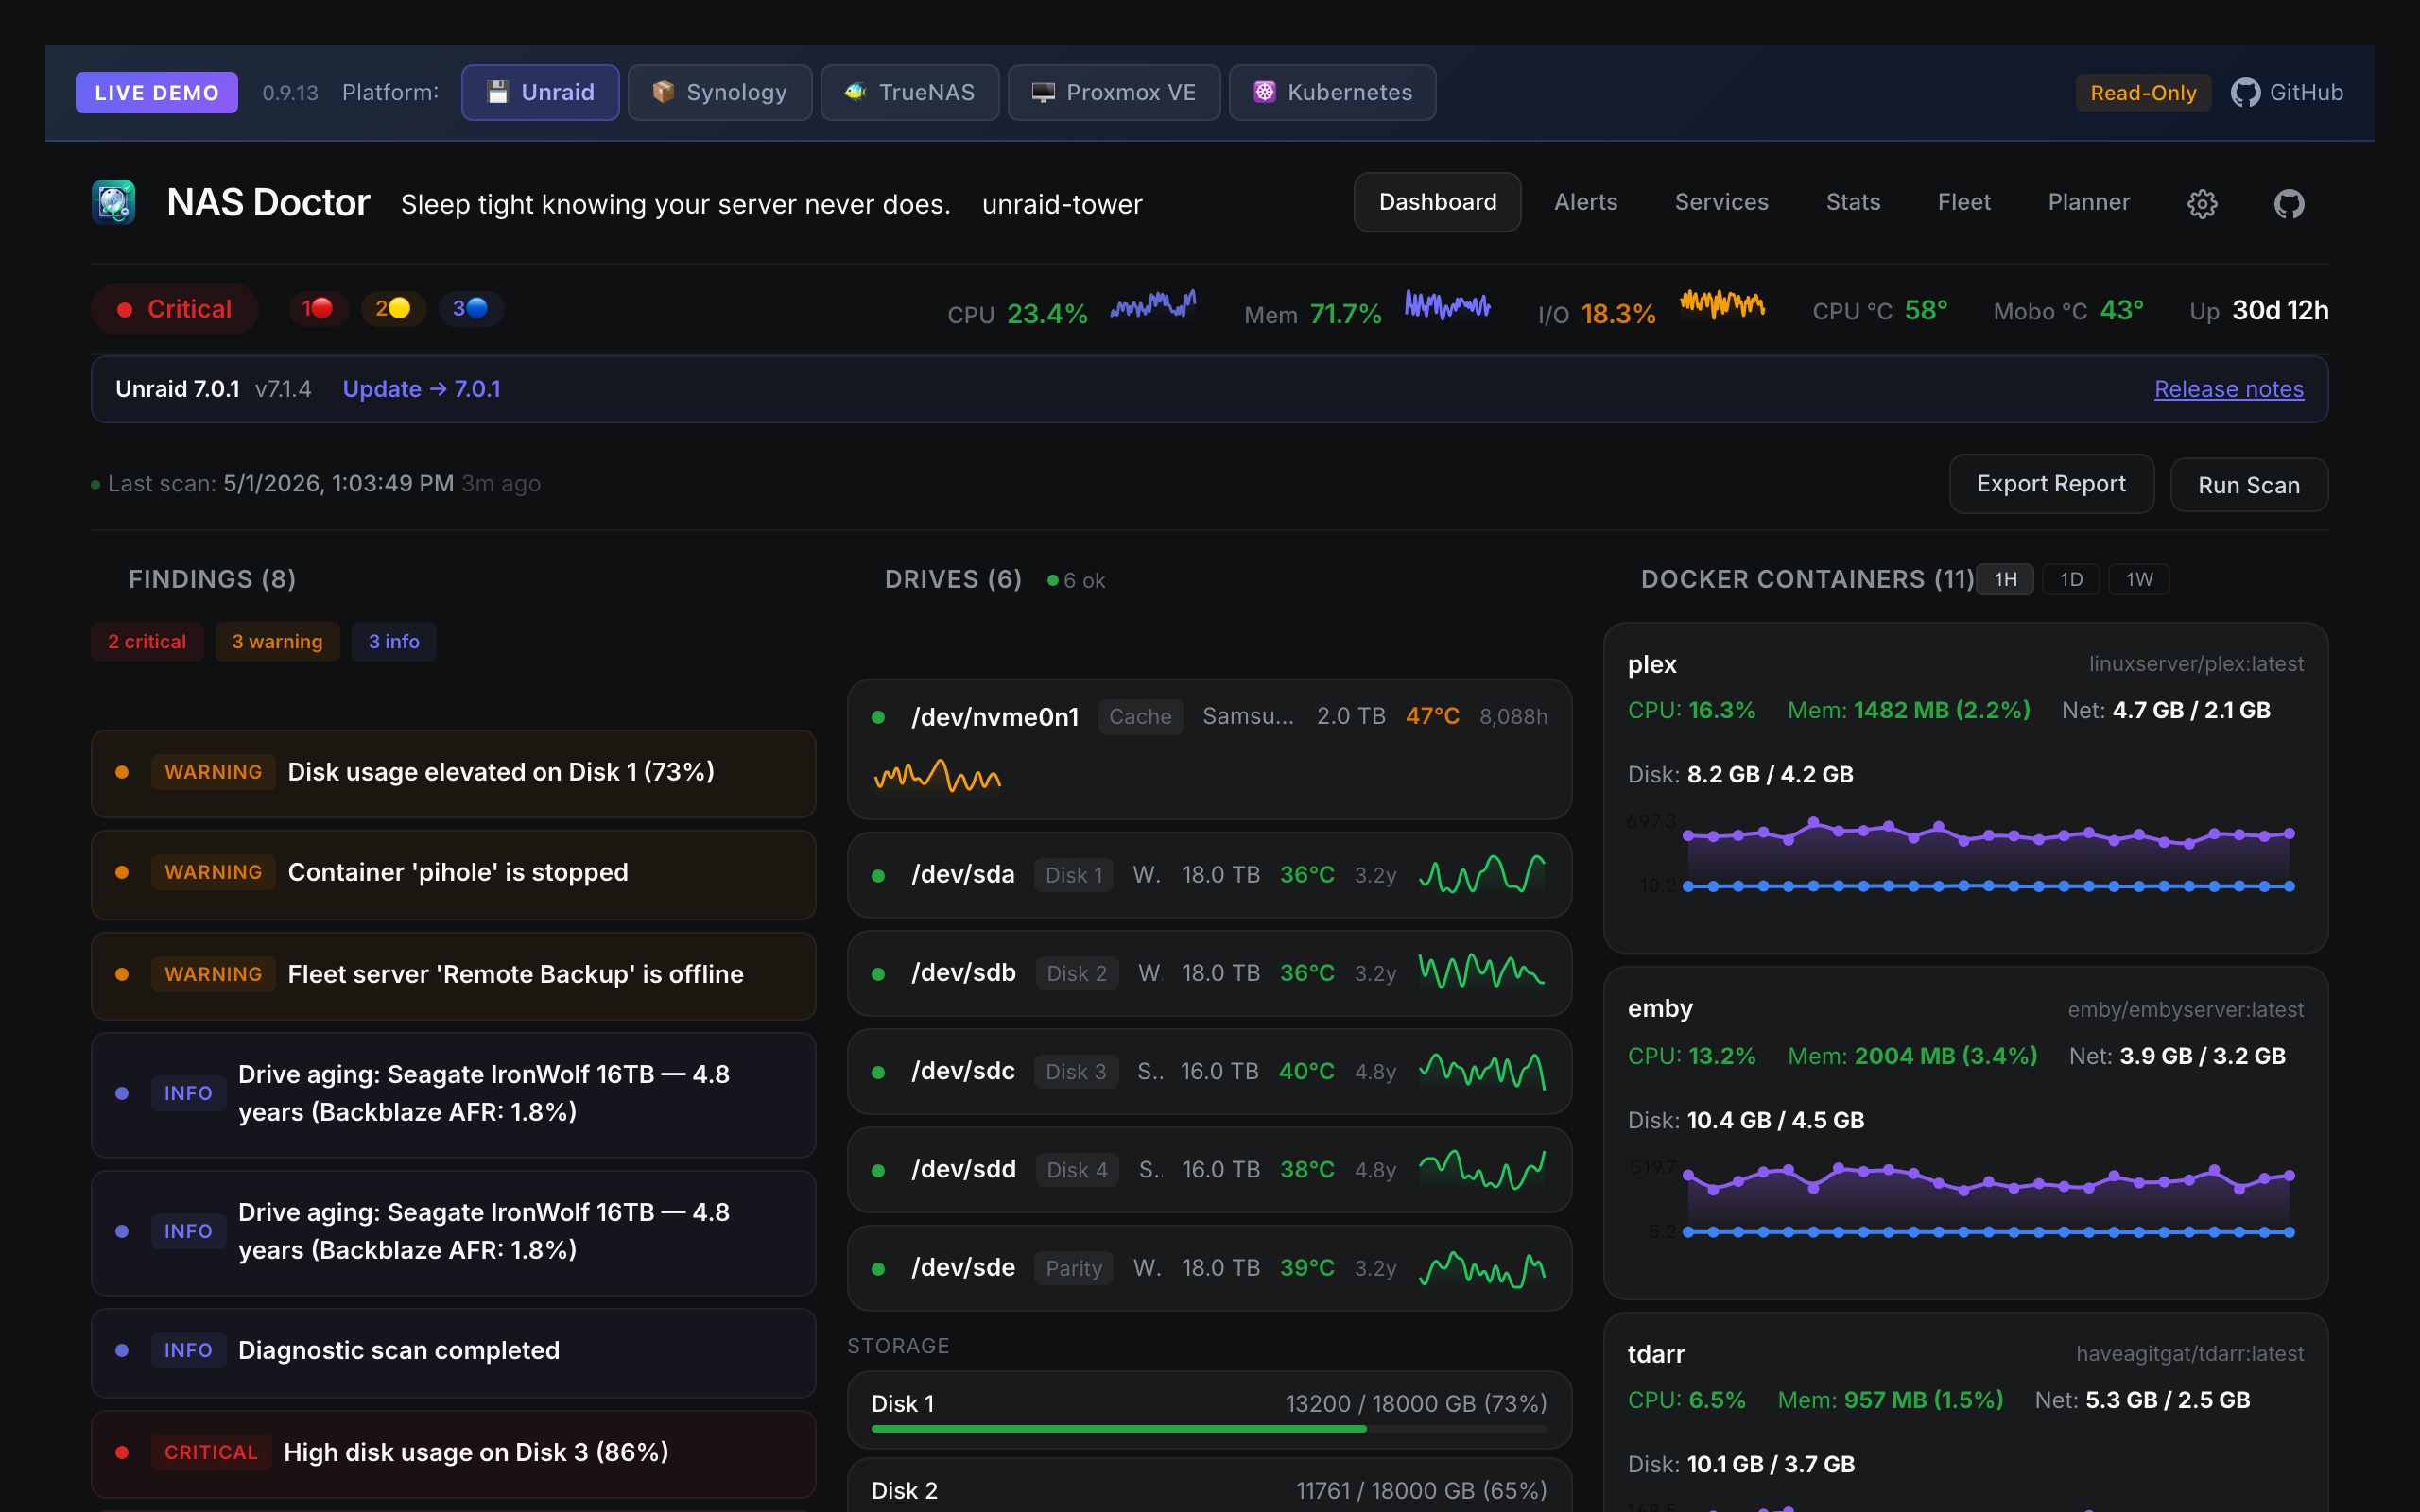
NAS Doctor runs periodic health checks on your server — analyzing SMART data, disk usage, Docker containers, GPU, network speed, process CPU, kernel logs, temperatures, ZFS pools, UPS power, and Unraid parity — then surfaces findings with clear severity ratings, root-cause correlation, and actionable recommendations backed by Backblaze failure rate data.
Table of Contents
- What It Does
- Quick Start
- Screenshots
- Settings
- API Reference
- Prometheus Metrics
- Supported Platforms
- File Structure & Data Locations
- Resource Usage
- Diagnostic Report
What It Does
Diagnostics
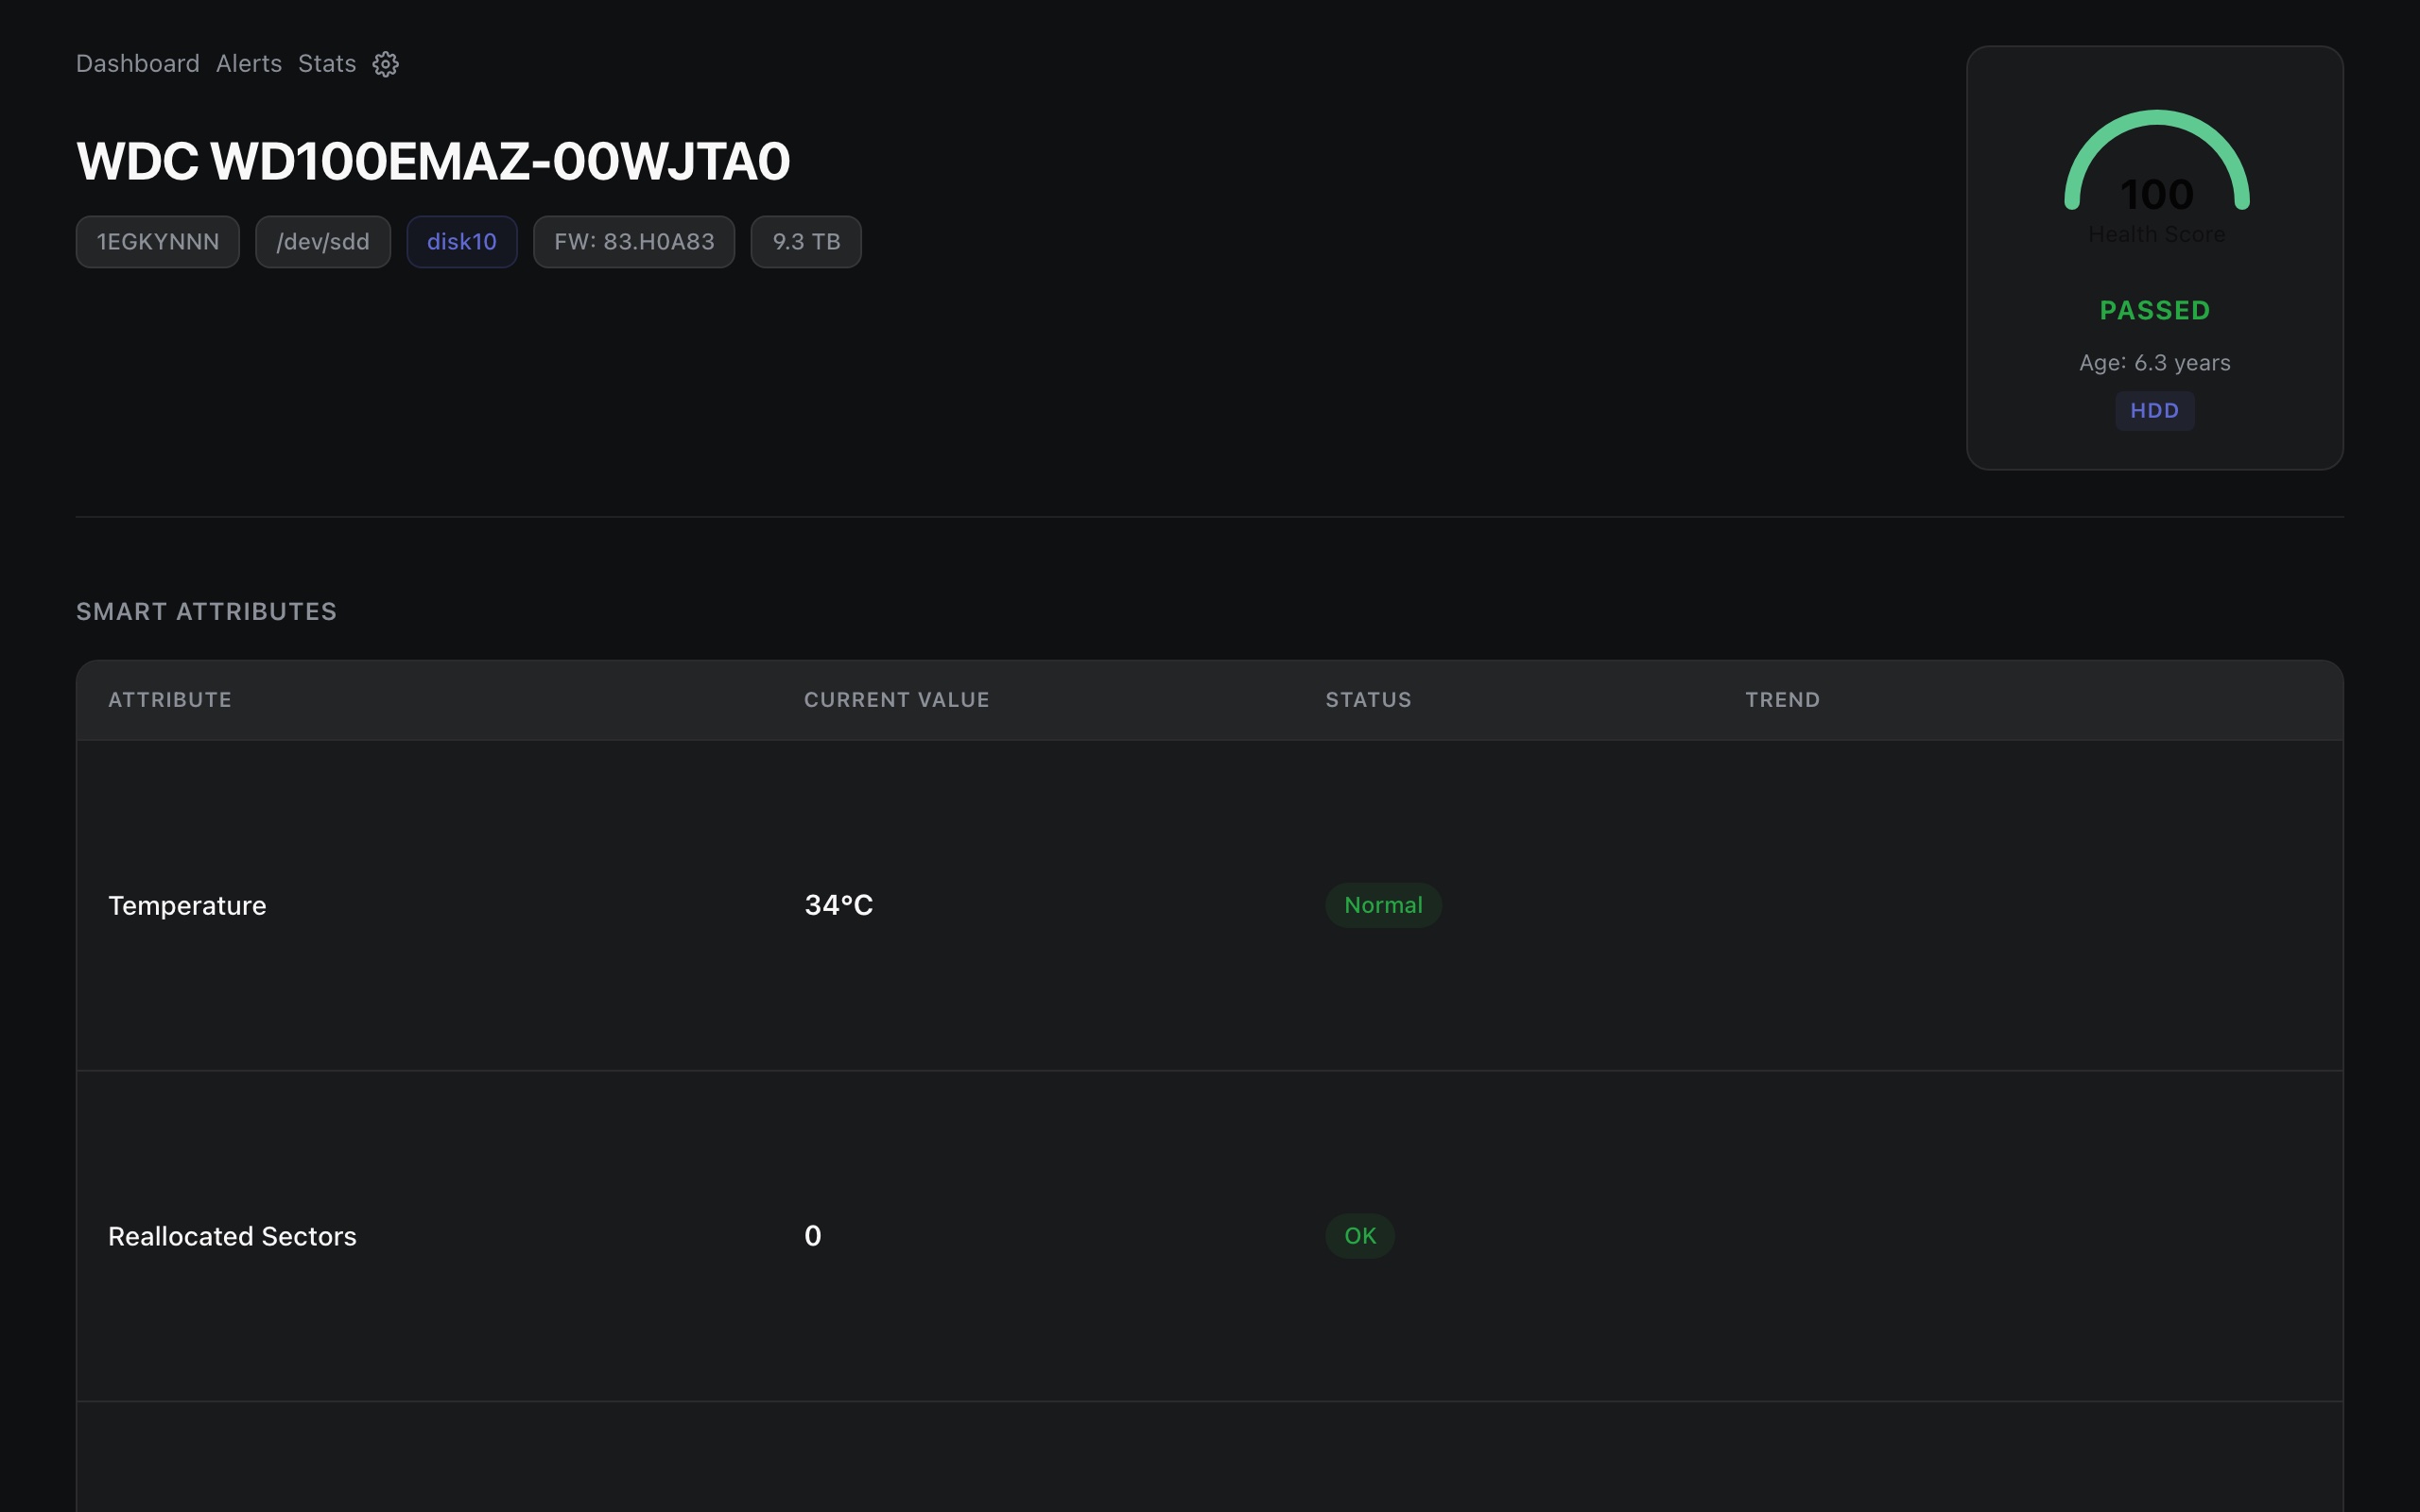
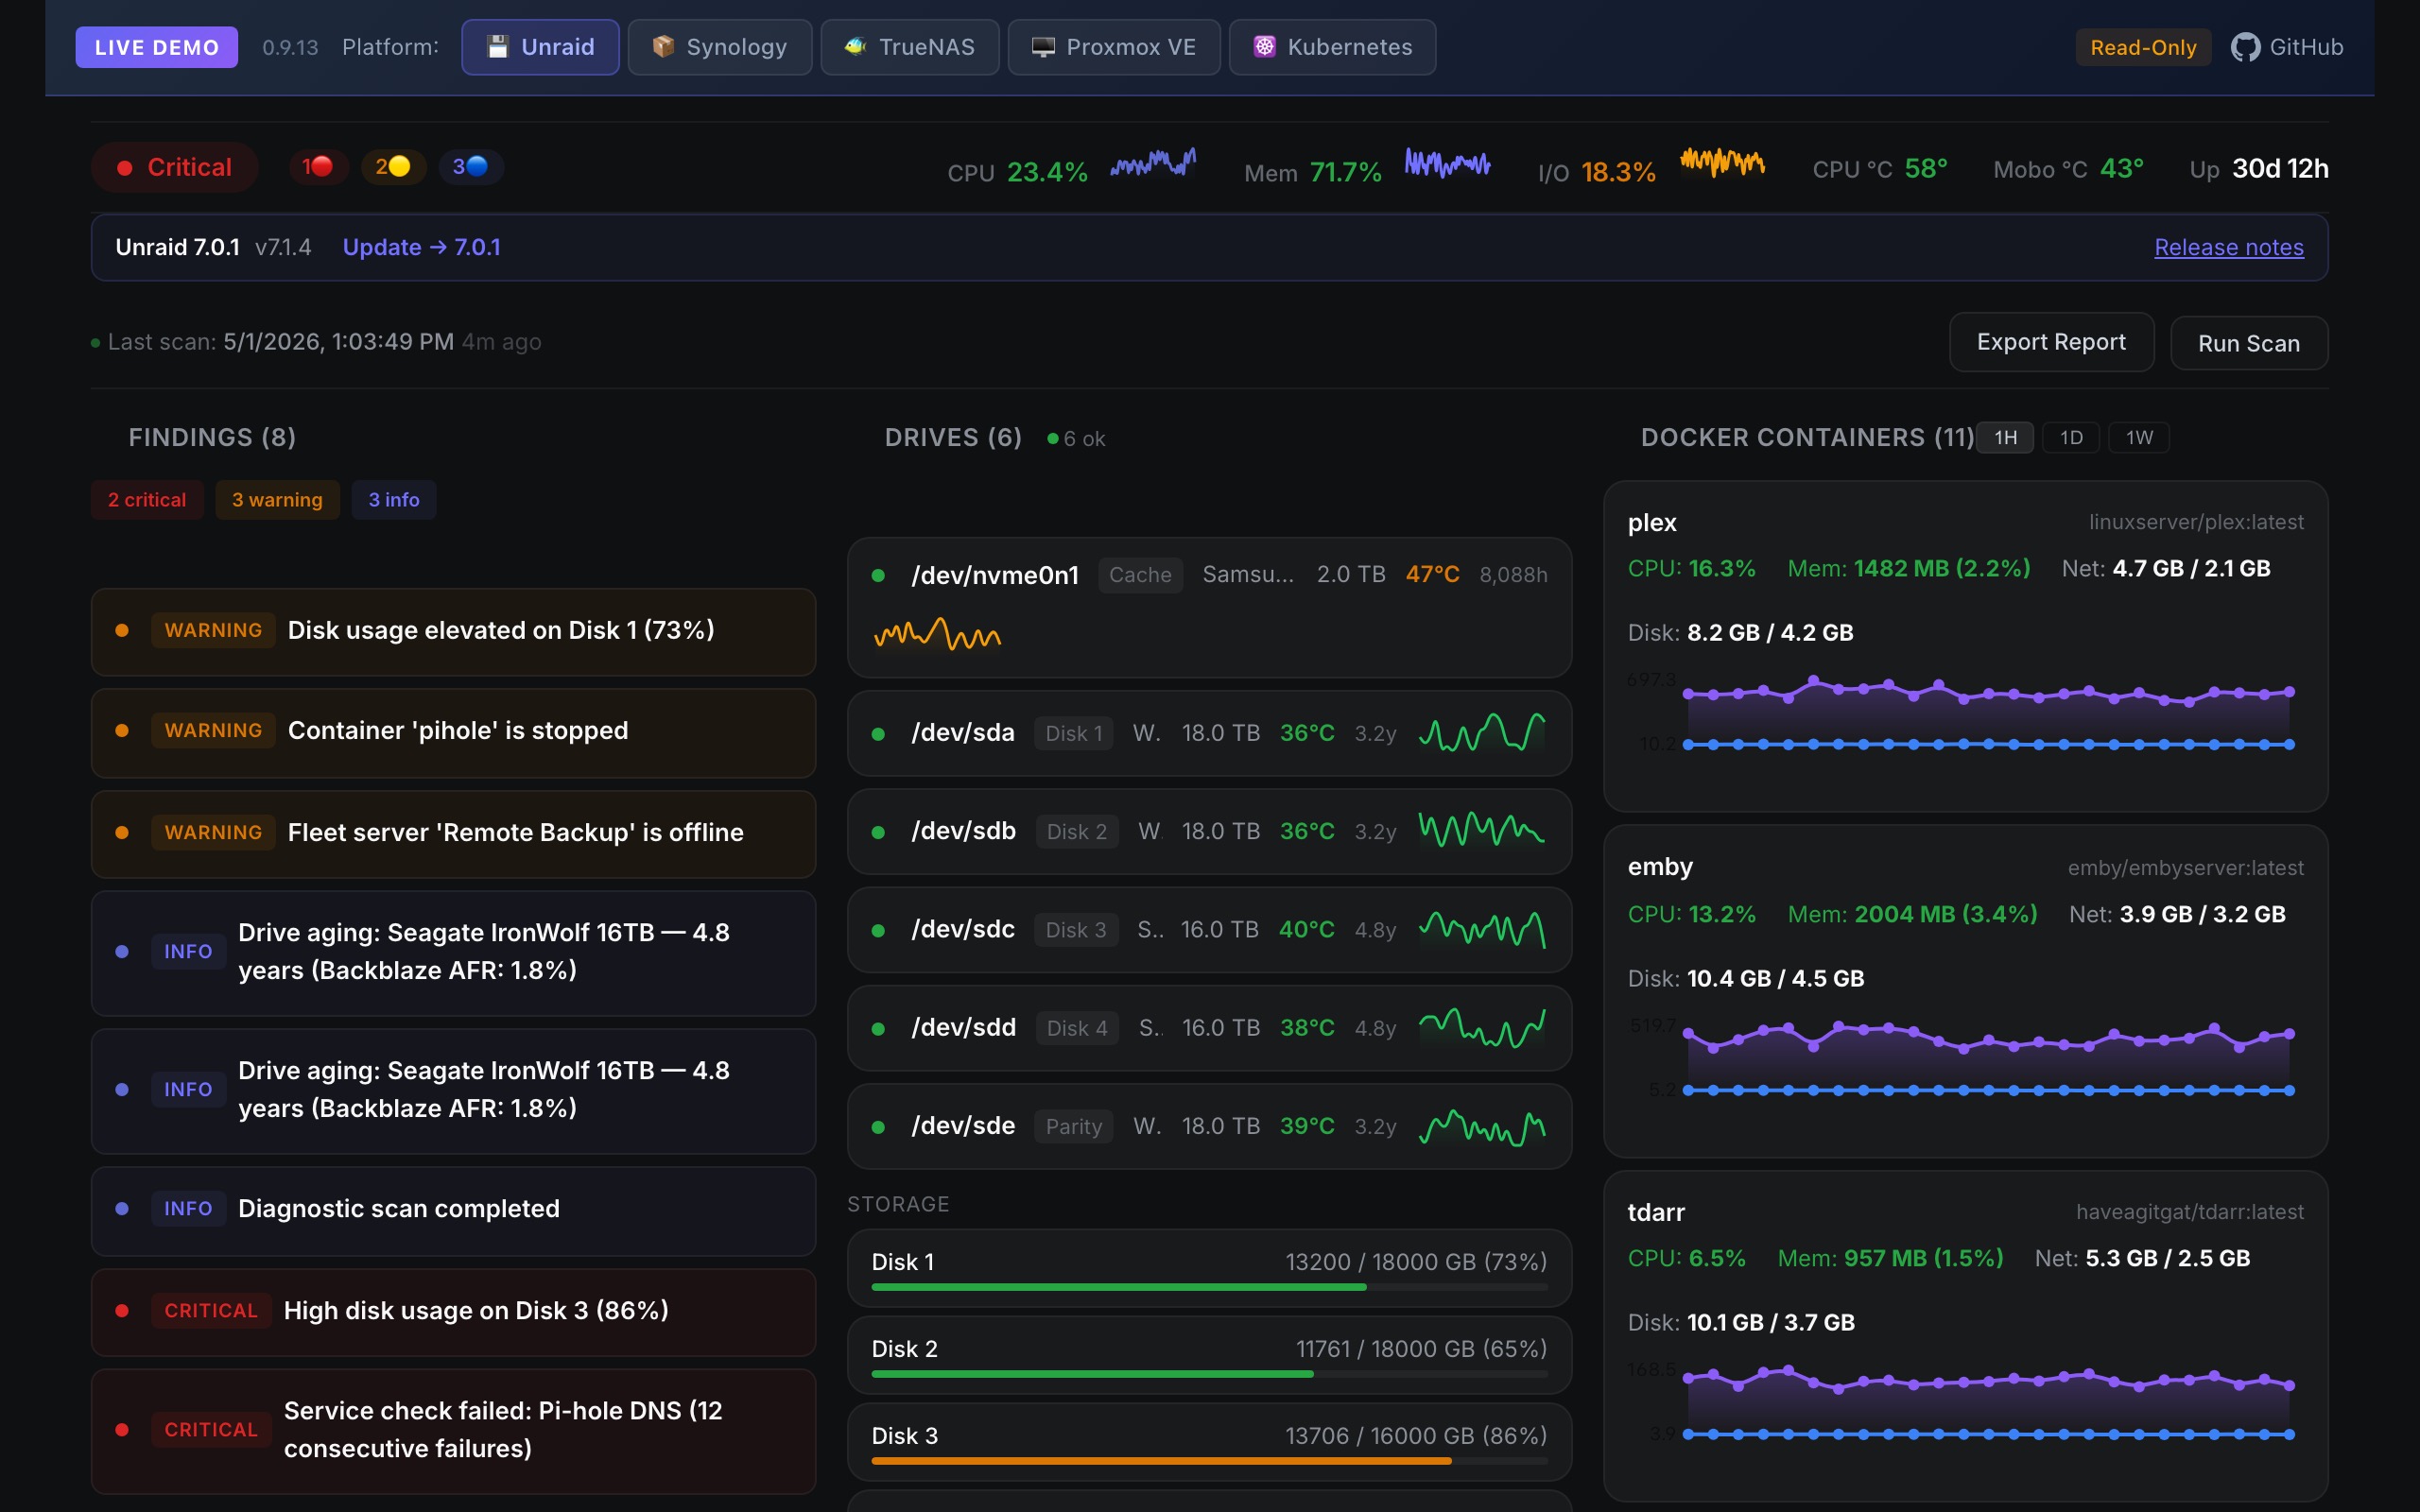
- SMART Health: Per-drive health, temperature, reallocated sectors, pending sectors, UDMA CRC errors, power-on hours, ATA port mapping, with Backblaze failure-rate thresholds (Q4-2025 data, 337k+ drives). By default, NAS Doctor respects drive standby and skips spun-down drives rather than waking them for SMART reads — history will show gaps for drives that spin down, which is intentional (reduces wear). Flip Wake drives for SMART check in Settings → Advanced to restore every-cycle polling (v0.9.4 behaviour).
- Historical Sparklines: CPU, memory, I/O wait, and per-drive temperature trends inline on the dashboard
- Disk Space: Usage per mount point with color-coded thresholds
- System: CPU, memory, load average, I/O wait, uptime, platform detection, CPU package temperature, mainboard temperature (auto-detected via
/sys/class/hwmon; rendered as colour-coded gauges in the dashboard header alongside CPU/Mem/I/O; gracefully hidden when no sensors are exposed, e.g. on Synology DSM) - Docker: Container listing with status and uptime
- ZFS Pool Health: Pool state, vdev tree, scrub/resilver status, ARC hit rate, fragmentation, dataset listing with compression ratios
- UPS / Power: Battery level, load, runtime, wattage via NUT or apcupsd (local or remote) — with critical alerts for on-battery and low-battery events
- Network: Interface speed negotiation, state, MTU
- Logs: Filtered dmesg and syslog errors (ATA errors, I/O errors, medium errors)
- Parity (Unraid): Historical parity check speed trend analysis, error tracking
- Tunnels: Cloudflared tunnel status (up/down; connector count on the host-binary path) and Tailscale peer graph (IPs, online/offline, relay, exit nodes) — Tailscale detects both host binary (bundled in the image) and Docker containers; Cloudflared detects Docker containers, with host-binary detection requiring a custom image that bundles the
cloudflaredCLI - Proxmox VE: Cluster status, nodes (CPU/mem/uptime), VMs + LXCs (status, resources), storage pools, HA services, recent tasks/backups — via PVE REST API with test connection
- Kubernetes: Cluster monitoring through the Kubernetes API (tested on k3s; other distributions should work but are untested) — nodes (status, ephemeral-storage capacity, pod capacity), pods grouped by node with namespace breakdown, deployments, warning events, plus findings for node pressure and Pending/Lost PVCs. In-cluster auto-detection + external token auth. Tailscale detection in Kubernetes requires a sidecar pod sharing
/var/run/tailscalevia emptyDir — see docs/tailscale-install-methods.md. - OS Update Check: Compares installed version against latest GitHub release for Unraid and TrueNAS
Analysis Engine
20+ diagnostic rules with automatic cross-correlation:
- UDMA CRC errors + slow parity → Root cause: SATA cable failure
- High temperatures + slow parity → Thermal throttling
- No SSD cache + high I/O wait + Docker containers → I/O starvation
- Pending sectors + reallocated sectors → Failing drive media
- Reallocated sectors at Backblaze 12.0x failure rate → Replace immediately
- ZFS pool DEGRADED with REMOVED vdev → No redundancy, replace disk
- UPS on battery with low runtime → Initiate graceful shutdown
- OS significantly out of date → Security vulnerability risk
- And more...
Alerts & Incident Management
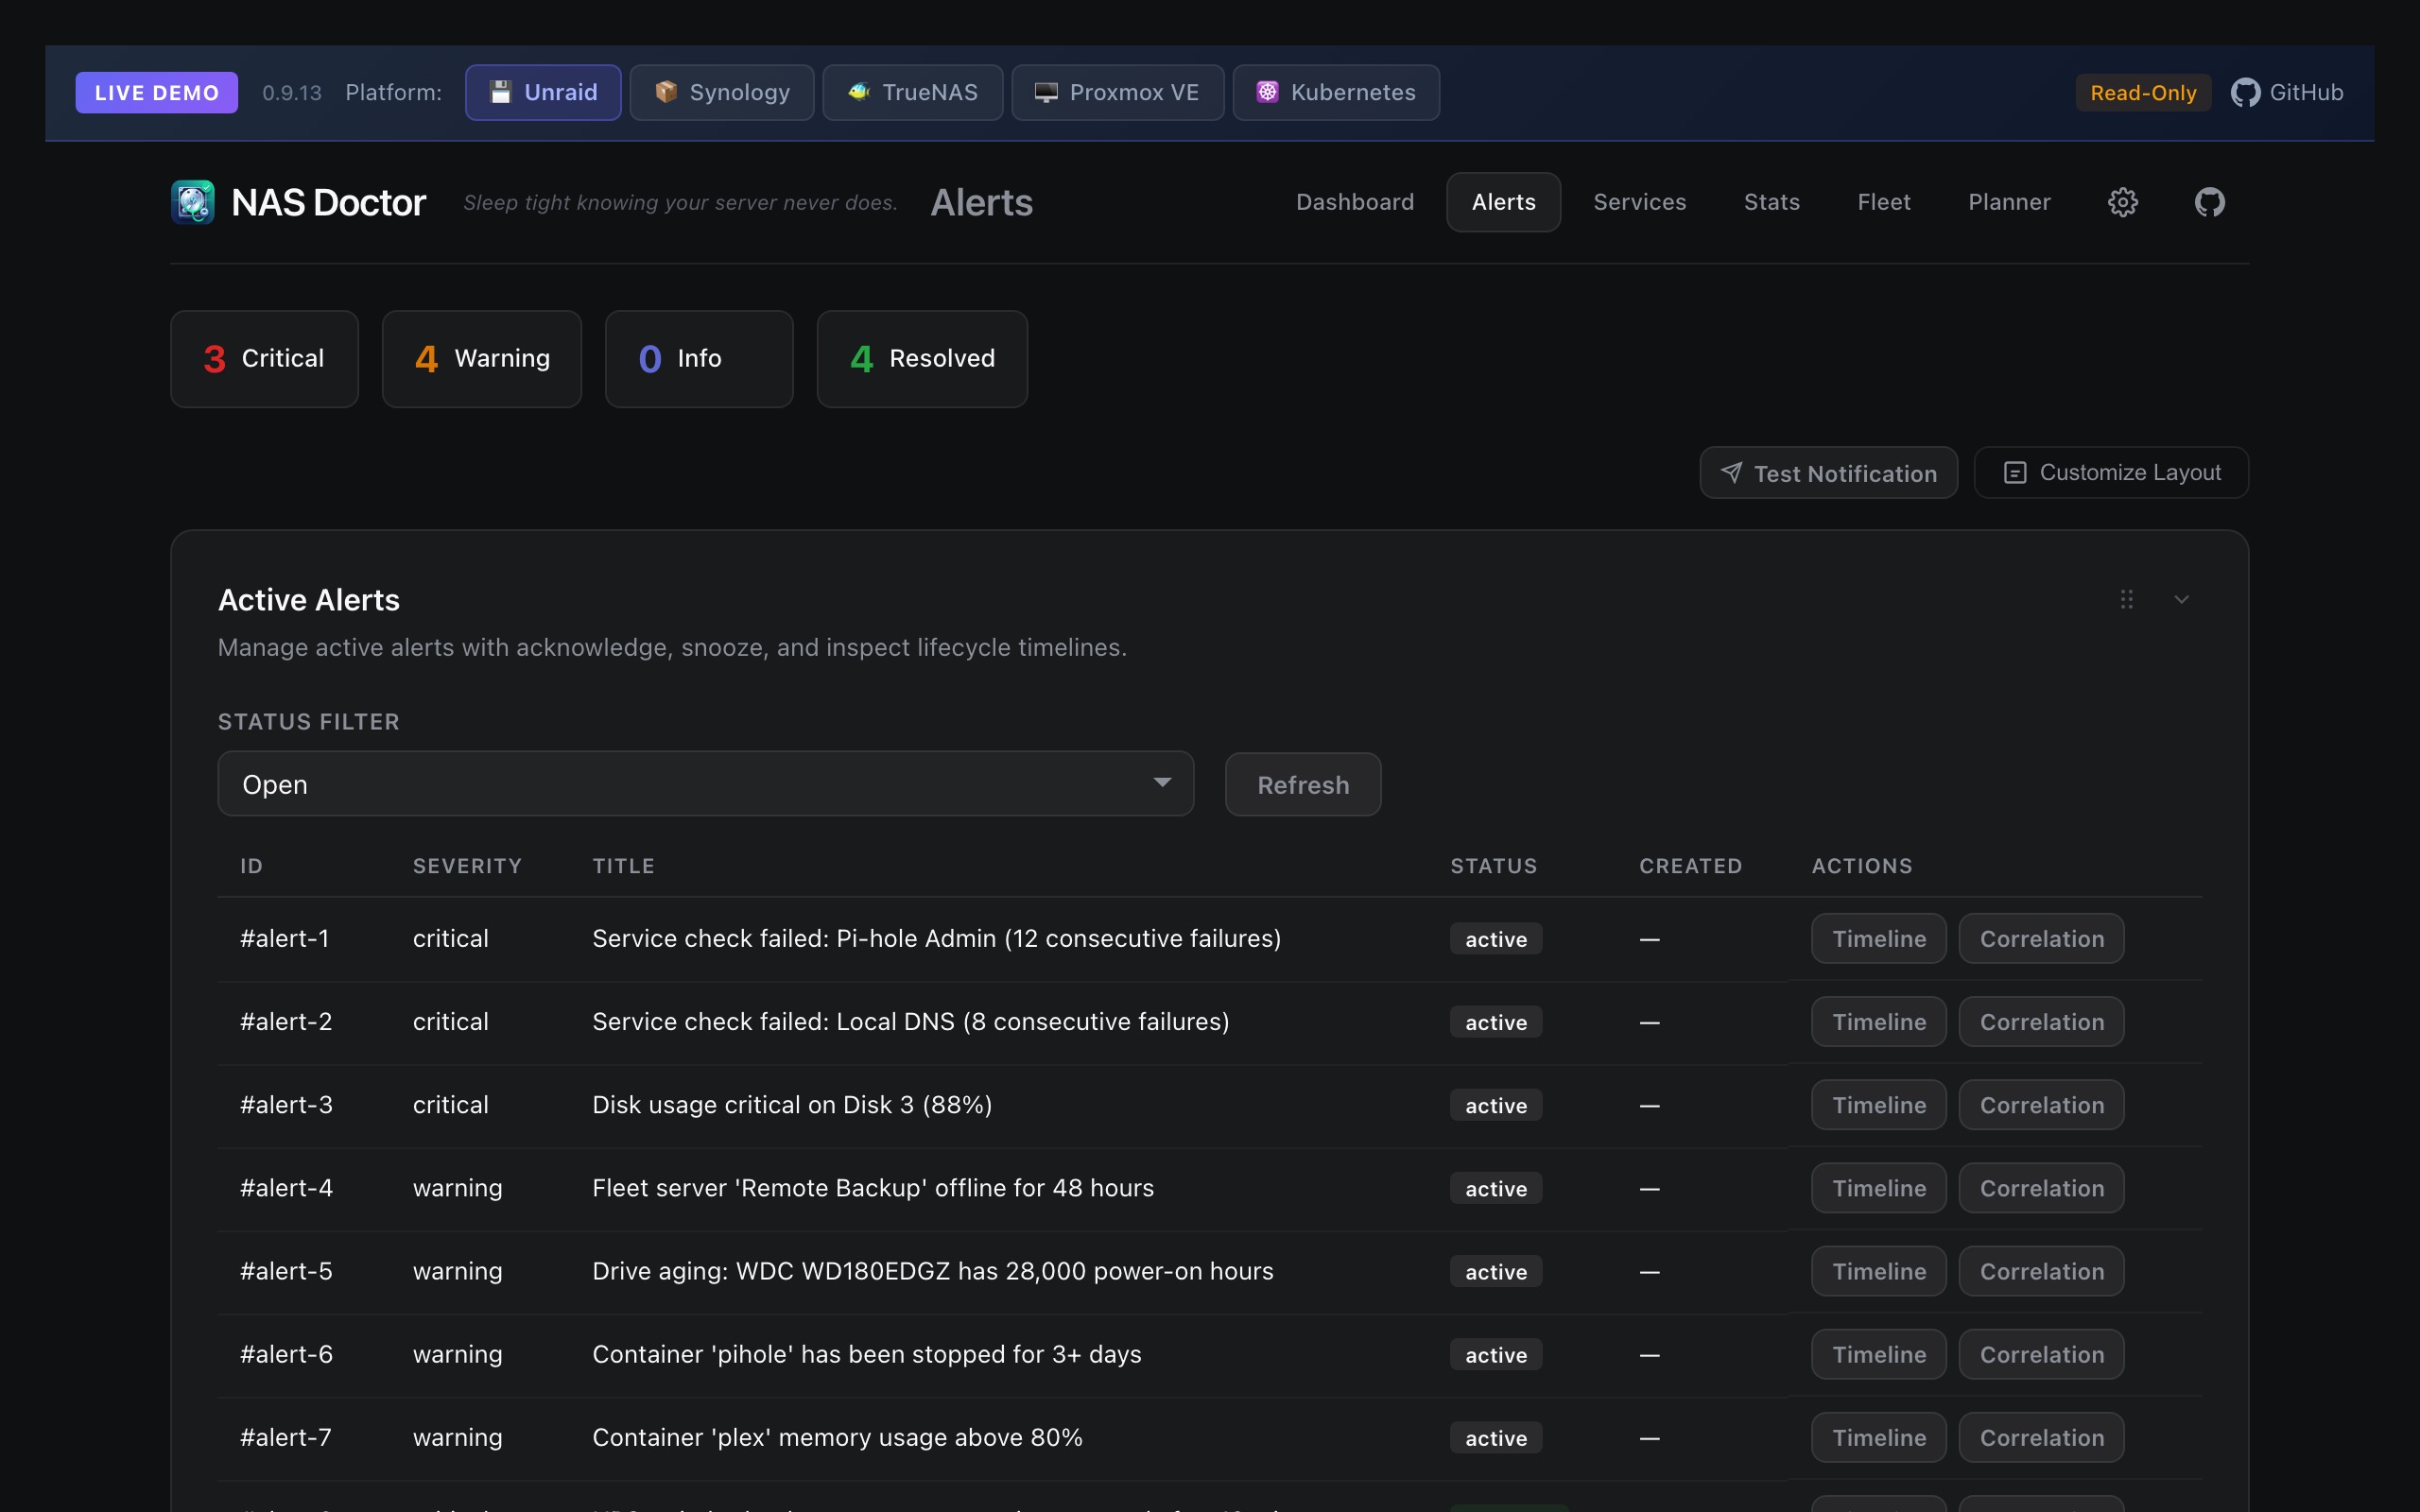
Dedicated /alerts page with:
- Active Alerts — acknowledge, snooze, unsnooze with full lifecycle timeline per alert
- Incident Timeline & Correlation — correlate alerts against CPU, memory, I/O wait, and disk temperature over selectable windows (24h/7d/30d)
- Predictive Trend Intelligence — worsening-pattern detection for SMART counters with urgency scoring, confidence levels, and parity risk markers
- Notification History — webhook delivery log with status, error details, and auto-refresh
- Draggable cards — reorder, collapse, and toggle card visibility with layout persistence
Service Checks
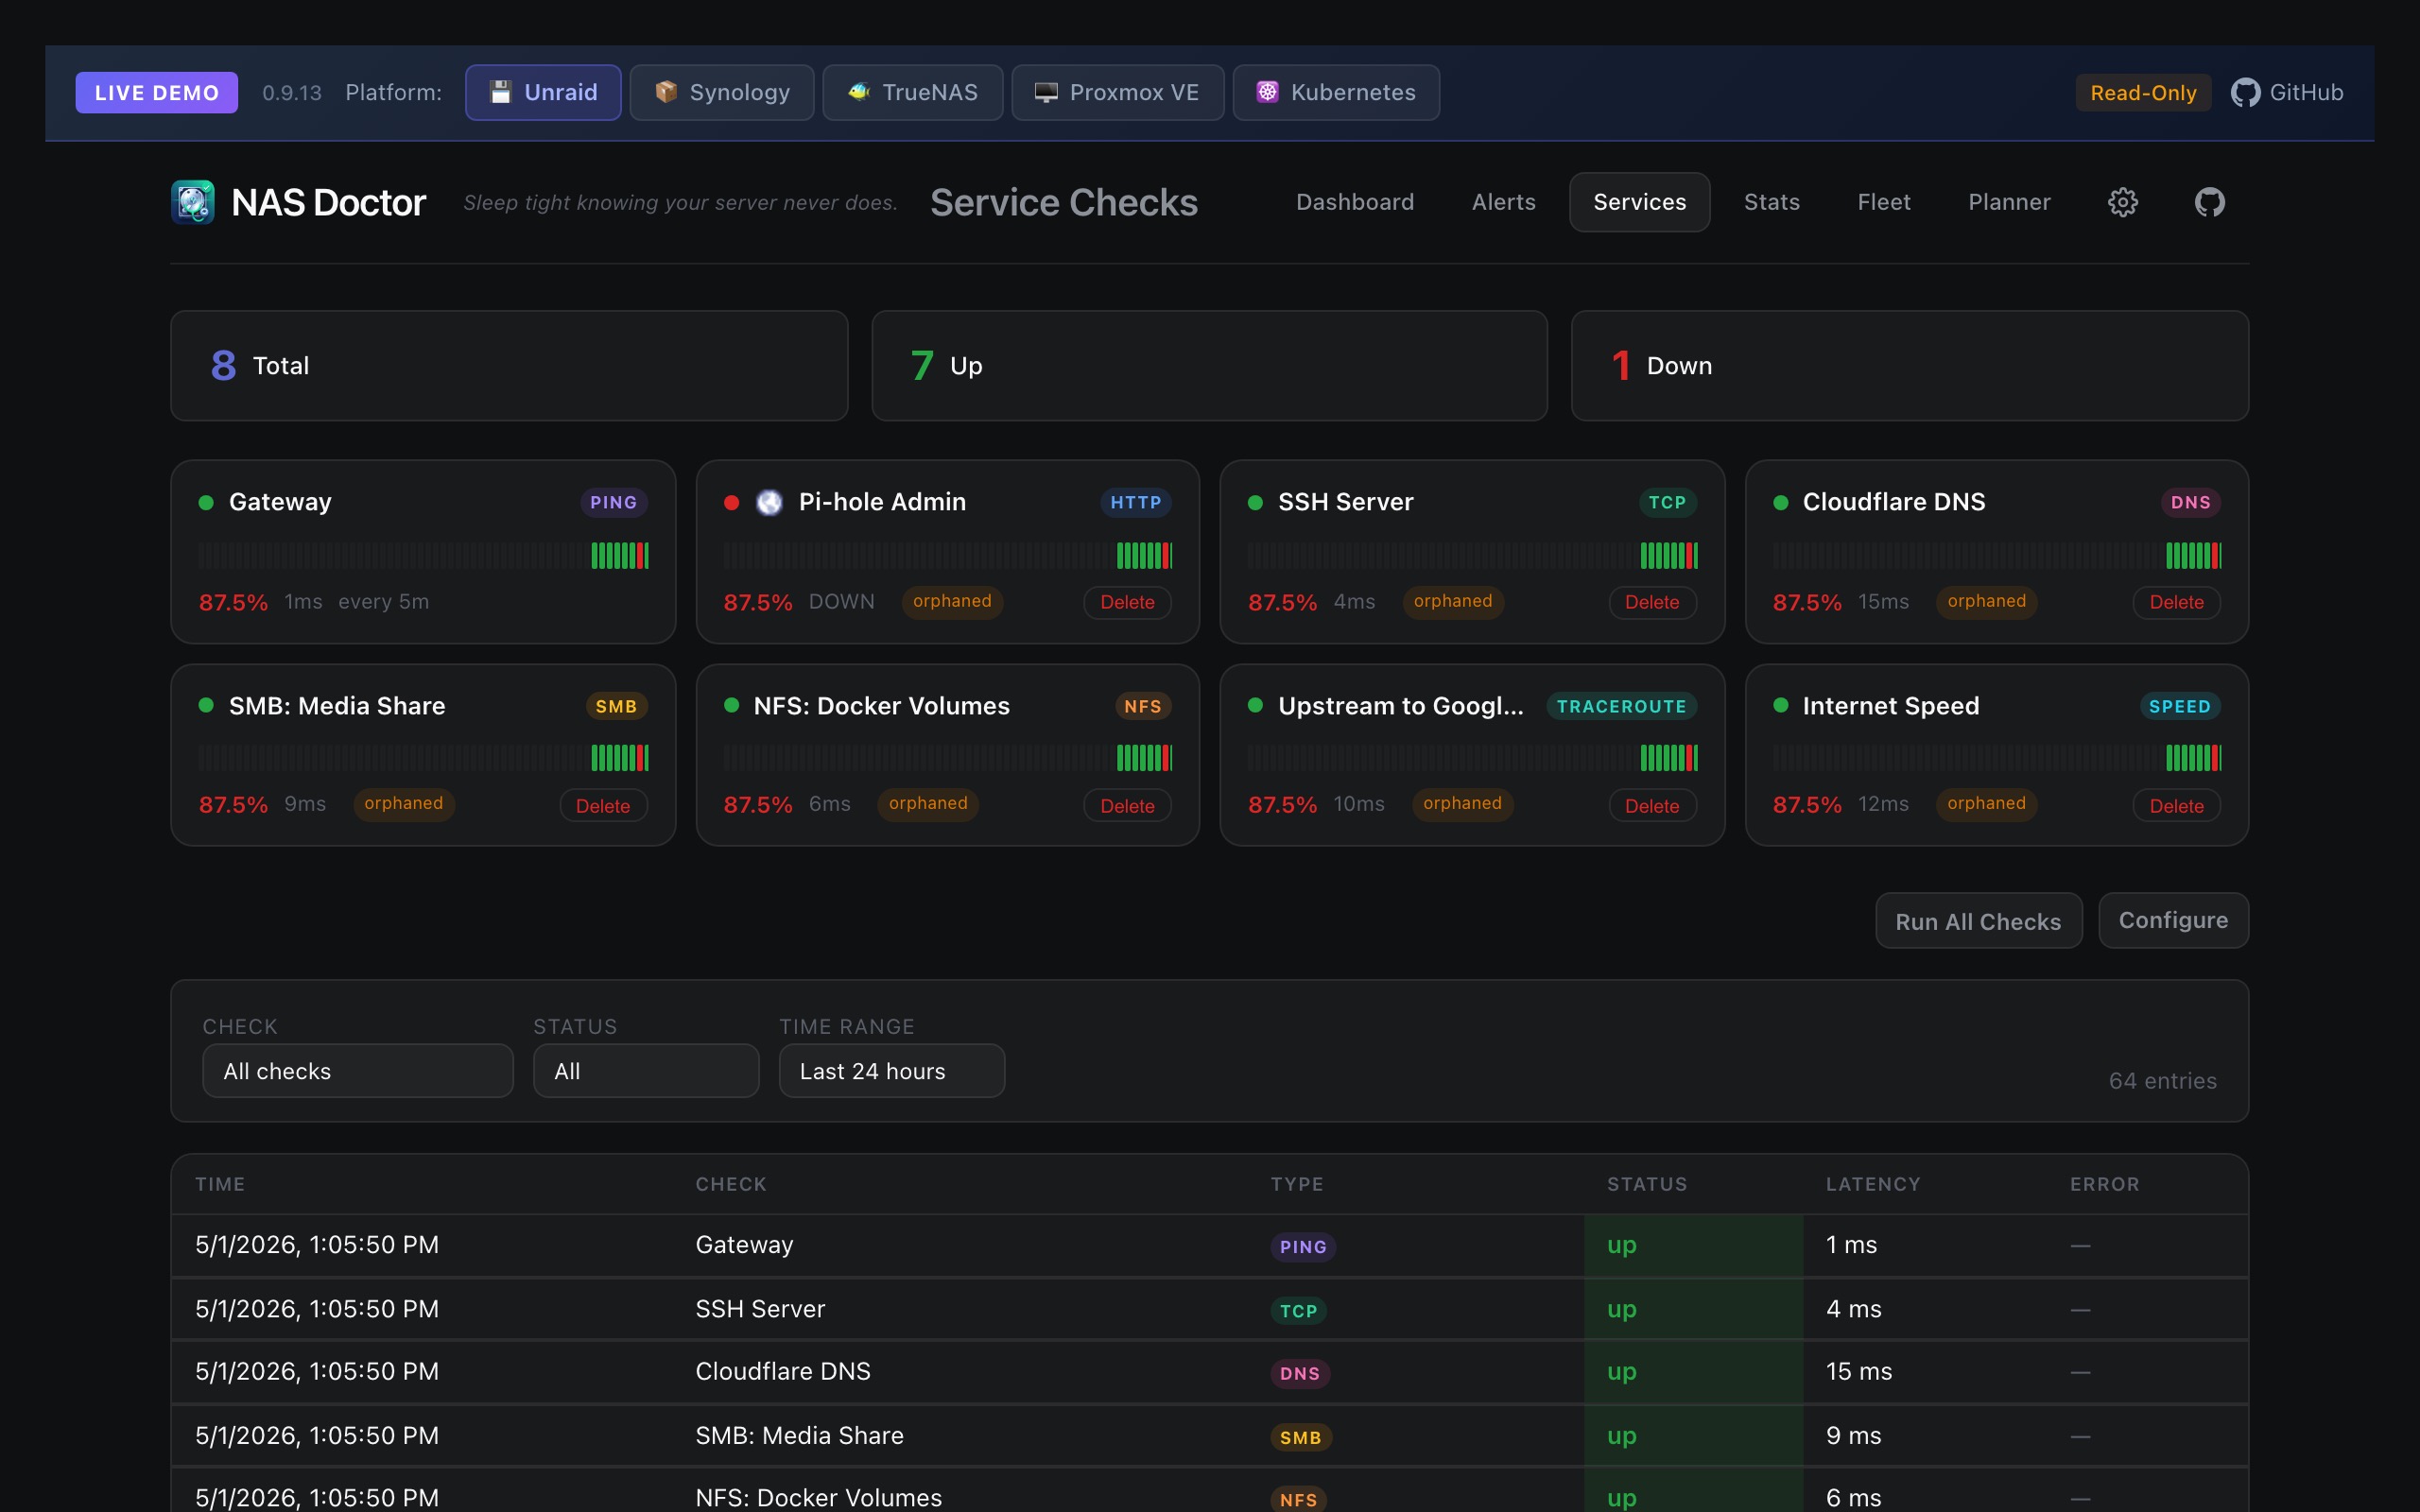
Dedicated /service-checks page with uptime monitoring:
- HTTP/HTTPS, TCP, DNS, Ping/ICMP, SMB, NFS, Traceroute and Speed Test check types
- Traceroute checks: the hop-by-hop path to a target via
mtr(bundled in the image), with latency and packet loss per hop - Speed checks: compare download/upload against contracted speeds with configurable margin of error. Three-state result: green (both pass), orange (degraded), red (both fail)
- Test before saving: the editor's Test button runs a check once. Traceroute shows hops as they're probed; a speed check shows the same live chart as the dashboard's speed test card, then the verdict and what the engine measured
- Per-check configurable intervals (30s to 1h) with independent scheduling loop
- Heartbeat badge cards — colored dots showing recent check status per service, with favicon for HTTP targets
- Paginated log table with filters (check name, status, time range)
- Historical response time tracking and uptime percentages
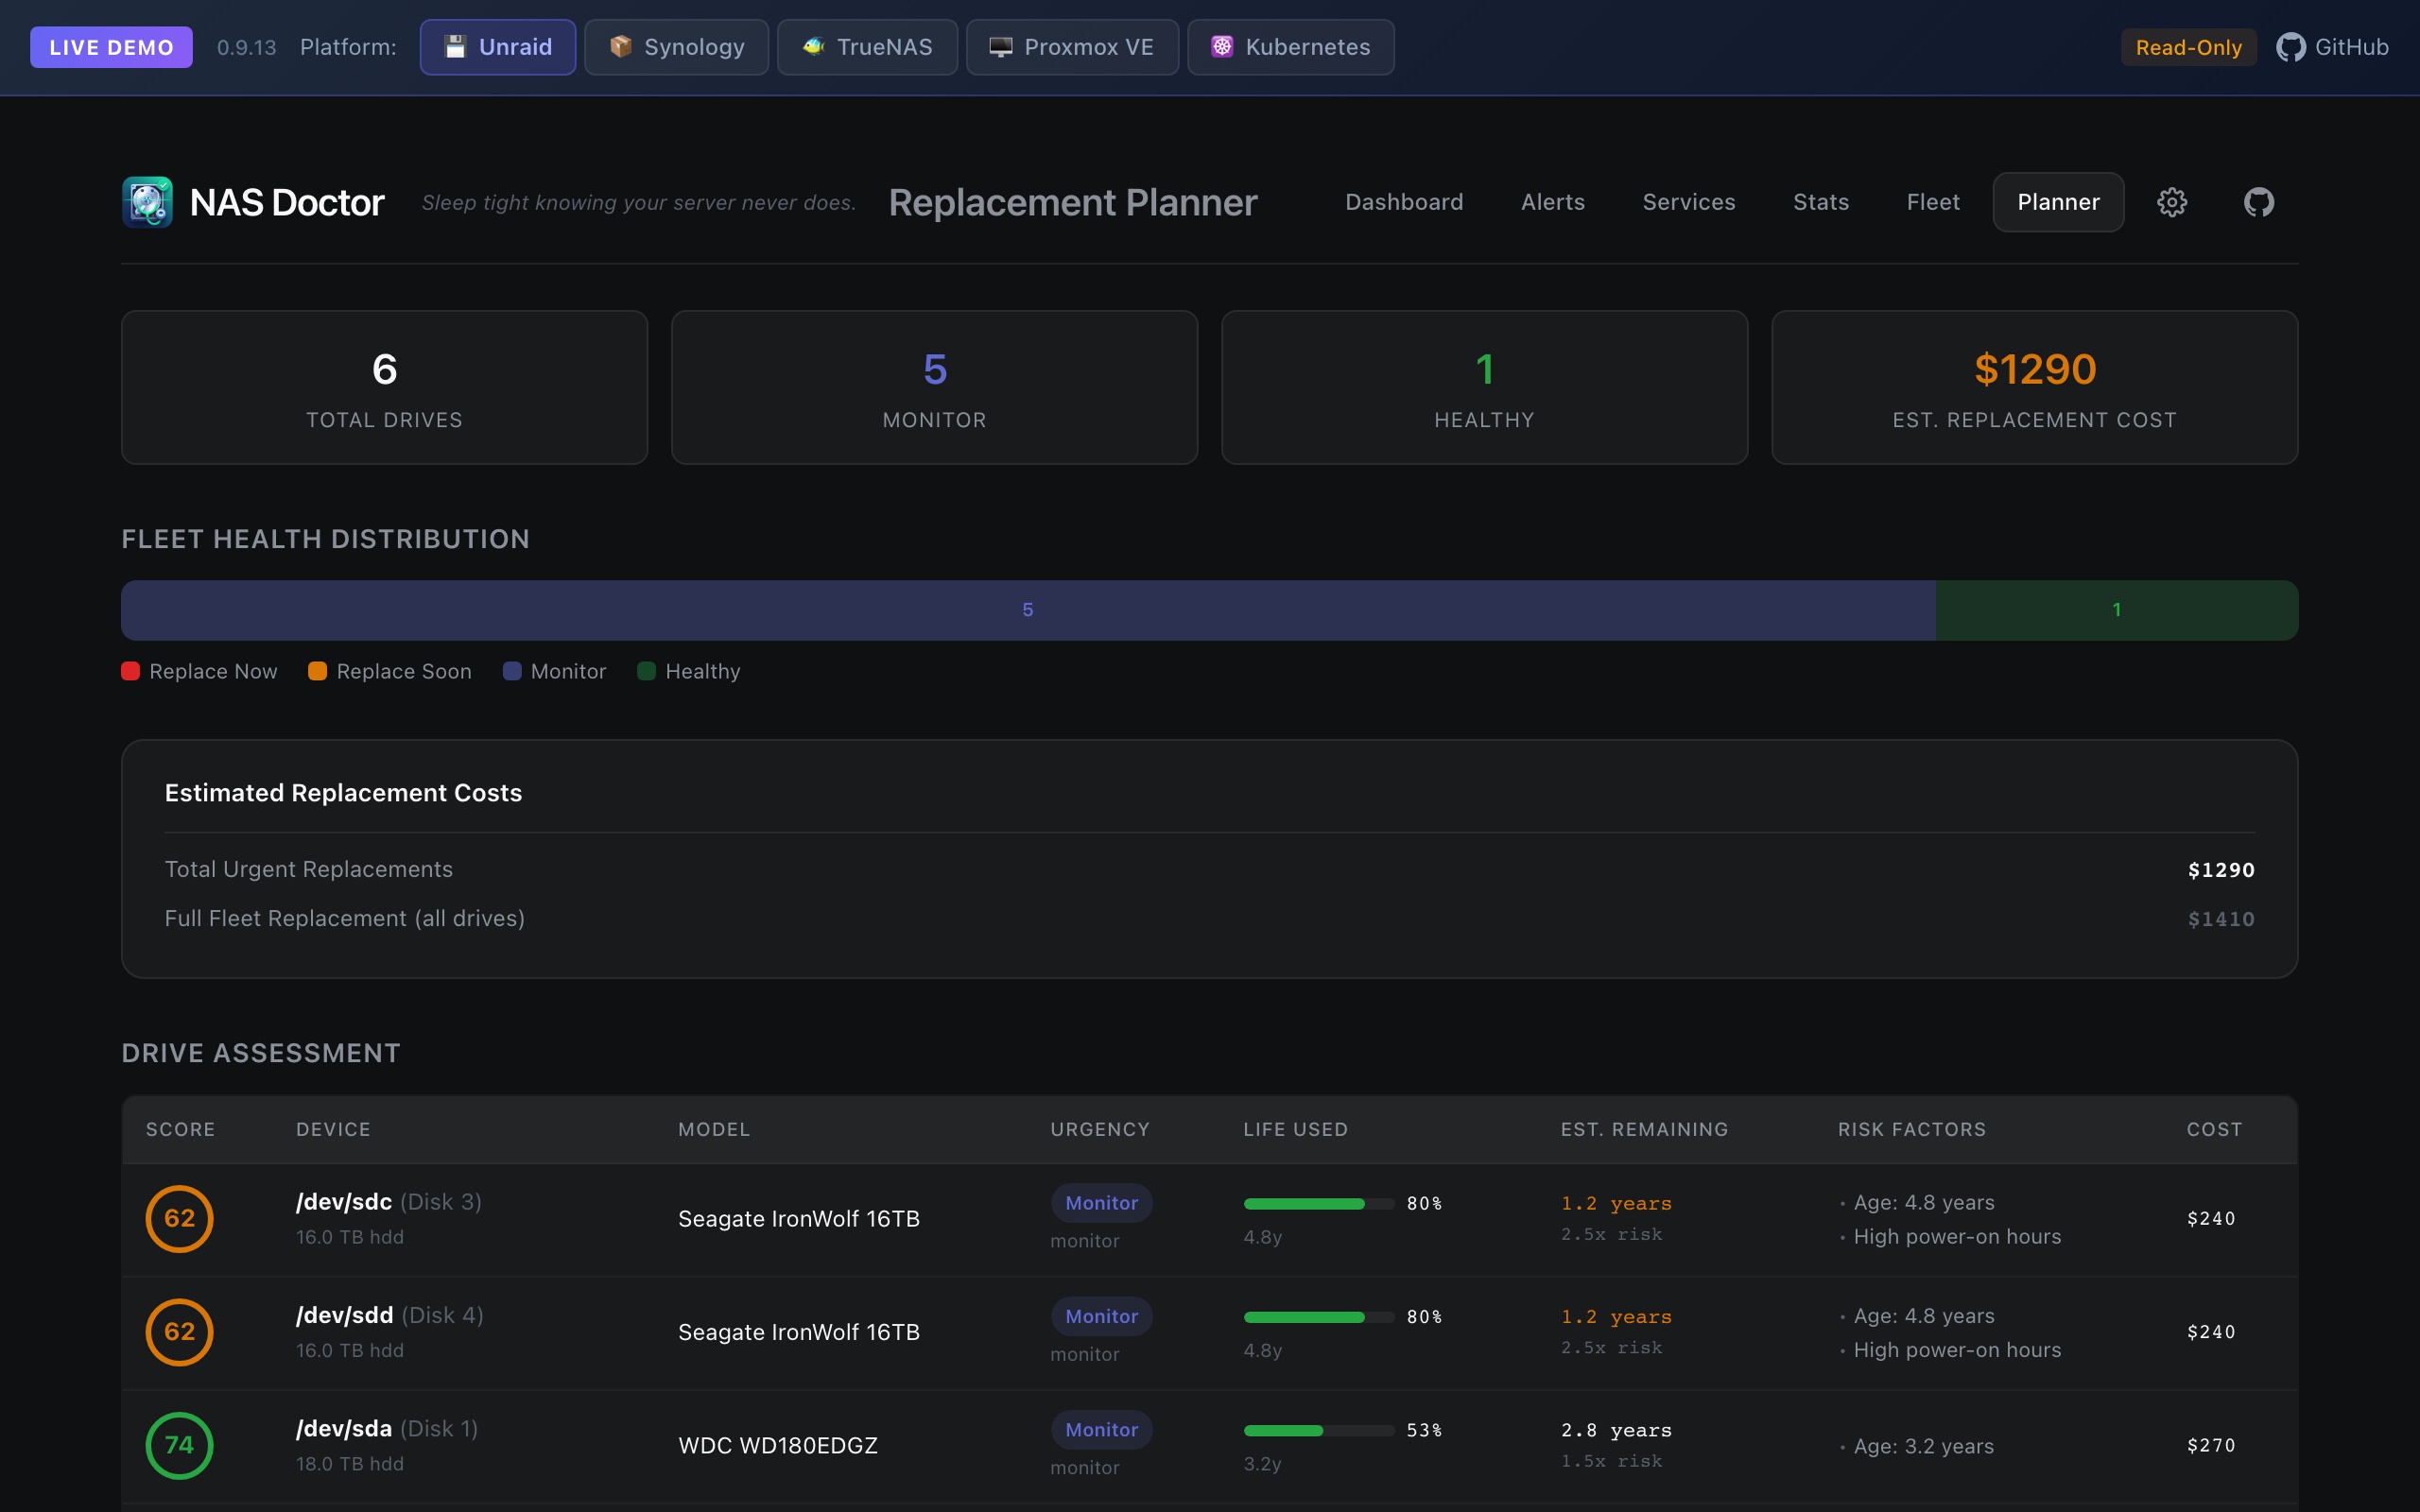
Drive Replacement Planner
Dedicated /replacement-planner page with proactive drive lifecycle management:
- Health scoring per drive — composite score based on age, temperature, SMART attributes, and Backblaze annualized failure rates (337k+ drives, Q4-2025 data)
- Urgency classification: Replace Now, Replace Soon, Monitor, Healthy — with color-coded cards
- Bathtub curve aging model — failure multiplier increases at infant (<6 months) and wear-out (>4 years) phases
- Cost estimates per drive — configurable cost-per-TB in Settings, shows per-drive and total replacement cost
- Risk factors — lists specific concerns per drive (age, temperature, reallocated sectors, power-on hours)
- Remaining life estimate — projected years remaining based on current age and rated endurance
Backup Monitoring
Auto-detects and tracks backups from the following tools when their CLI is reachable from the NAS Doctor container:
- Borg, Restic, Proxmox Backup Server (PBS), Duplicati — probed via
exec.LookPathat each scan - Duplicacy — disk-read, no
duplicacybinary required (since v0.10.0). Configure CLI repos or saspus/duplicacy-web cache layouts in Settings → Advanced → Backup Monitors → Duplicacy. See Duplicacy Monitoring below. - Tracks last backup time, size, snapshot count, duration, encryption status
- Stale backup alerts: warning >24h, critical >48h, failed backups
Note: Restic, PBS, and Duplicati binaries don't ship in the NAS Doctor Docker image. Borg is bundled (since v0.9.10; see External Borg Monitoring below) and can be pointed at host-managed repos via a Read Only bind-mount — no custom image needed. Duplicacy needs no binary at all (disk-read; see Duplicacy Monitoring below). For Restic/PBS/Duplicati the Backup dashboard section stays empty unless you install the provider CLI inside the container (custom Dockerfile) or run the provider in a sibling container that shares volumes/network with NAS Doctor.
External Borg Monitoring (host-managed repos)
If your Borg setup runs on the host (e.g. Unraid User Scripts, Synology Task Scheduler) rather than inside the NAS Doctor container, you can still monitor it. Borg is bundled in the image so the binary requires no host mount — just bind-mount the repo path Read Only.
NAS Doctor uses
borg --bypass-lockto avoid writing to the repo, so a Read Only mount is safe. The only theoretical race (read during a concurrentborg createby the host) produces a momentarily-stale archive count until the next scan — no corruption.
Configure in Settings → Advanced → Backup Monitors → Borg:
- Repo Path — path to the Borg repo visible inside the container.
Bind-mount your host's repo location into the container first, as
Read Only (
:roorMode="ro"). Example: host/mnt/user/appdata/borg/repo→ container/mnt/user/appdata/borg/repo(RO). - Label — optional display name for the dashboard (e.g.
Offsite). - Passphrase Env Var — optional, defaults to
BORG_PASSPHRASE. The name of a Docker env var containing the repo's passphrase. NAS Doctor never stores the passphrase itself — it only reads the env var you set on the container. - SSH Key Path — optional, for
ssh://remote repos. Absolute path inside the container (bind-mount your key file read-only). - Binary Path — optional override. Leave blank to use the bundled binary. Overrides must be musl-compatible (the Alpine base image can't exec glibc-linked binaries).
Each entry has a Test button that probes the repo on demand. Failed
repos render as red error cards on the dashboard with a specific reason
(binary_not_found, repo_inaccessible, passphrase_rejected,
ssh_timeout, corrupt_repo, unknown) so you can tell at a glance
which of your repos needs attention.
Worked Unraid example — host runs Borg via User Scripts with repo
at /mnt/user/appdata/borg/main, encrypted:
# In the Unraid Docker config for nas-doctor:
Path:  /mnt/user/appdata/borg/main  →  /mnt/user/appdata/borg/main (RO)
Env:   BORG_PASSPHRASE              =  <your-passphrase>
Then in Settings → Advanced → Backup Monitors → Borg → Add Borg repo:
Enabled:           on
Label:             Main
Repo Path:         /mnt/user/appdata/borg/main
Binary Path:       (leave blank — uses bundled borg)
Passphrase Env:    BORG_PASSPHRASE
SSH Key Path:      (leave blank — local repo)
Click Test to verify; the response shows the archive count on success or a specific error reason on failure. No container restart needed — the repo appears on the dashboard at the next scan tick.
Duplicacy Monitoring (disk-read, no binary required)
Both vanilla Duplicacy CLI installs and the popular
saspus/duplicacy-web
container are monitored by reading the on-disk JSON snapshot files
that Duplicacy writes alongside its repo cache — no duplicacy binary
is invoked, no subprocess spawned, no network call made. This sidesteps
Duplicacy's source-available CLI licence (so we don't bundle a binary)
and works equally well for both deployment shapes.
Configure in Settings → Advanced → Backup Monitors → Duplicacy:
- Kind —
cli-repo(vanilla CLI install) orweb-cache(saspus/ duplicacy-web container layout). - Path — repo root (cli-repo) or the cache root (web-cache), visible inside the NAS Doctor container. Bind-mount your Duplicacy path Read Only — disk-read makes RO mounts safe.
- Storage ID — only for
kind=web-cache. Names the per-repo subdir under Path that the saspus container writes to. - Stale After (days) — repo whose newest snapshot is older than
this threshold reports the
stalereason. Default 30 days; set per-entry to support mixed daily/weekly/monthly schedules. - Label — optional display name for the dashboard.
Each entry has a Test button that runs the disk-read against the tentative config and shows the outcome immediately (no save+scan+wait loop). Reason codes are a closed set:
ok · path_not_found · path_unreadable · not_a_duplicacy_repo ·
storage_id_not_found · no_snapshots_yet · stale · corrupt_snapshot
The dashboard widget renders one row per configured entry with the
kind tag (DUPLICACY:CLI-REPO / DUPLICACY:WEB-CACHE), a
severity-coloured status pill keyed off the reason code (ok=success,
no_snapshots_yet=info, stale=warning, anything else=error), snapshot
count, last-backup-age, and an orthogonal RUNNING badge when a
lock or incomplete marker is detected on disk. Failed entries
render as red error cards with the specific reason so users can tell
at a glance whether they have a misconfigured Path, a missing Storage
ID, or a fresh-never-run repo.
Per-entry Prometheus gauges:
nasdoctor_backup_duplicacy_snapshots_total,
_last_backup_age_seconds,
_last_backup_size_bytes,
_status (1 for the entry's current reason
code, 0 for the others — same convention as
nasdoctor_speedtest_engine).
Network Speed Test
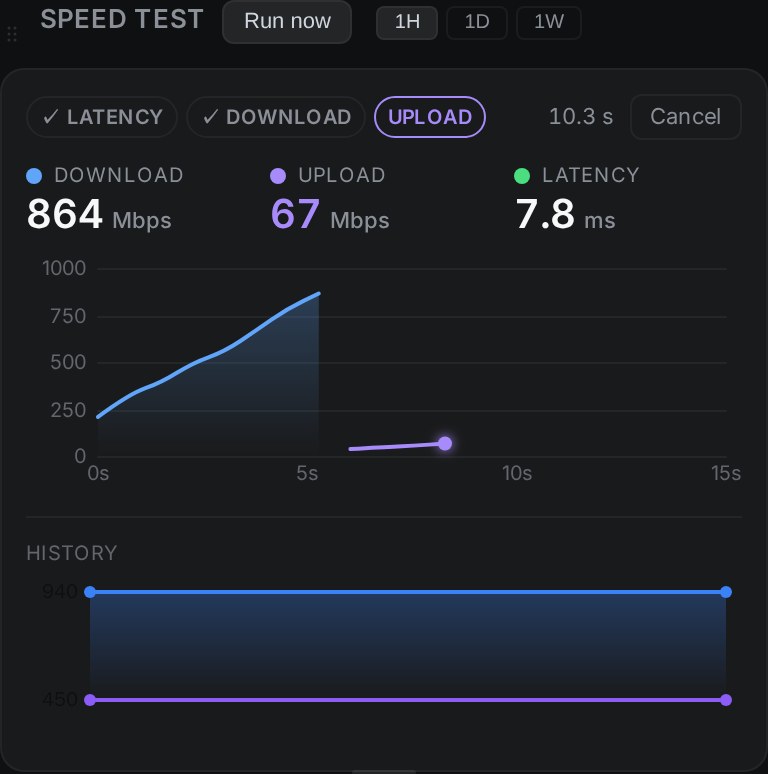
- Live progress during a test: the dashboard's speed test card shows a
LATENCY → DOWNLOAD → UPLOADstepper, live readouts for download, upload and latency, and a chart of download and upload Mbps as the test runs. When it finishes, the result and that run's chart stay in the card until you close them, and the card's figures and history update behind them. A speed check's Test button in Settings uses the same panel. Progress streams over Server-Sent Events, so several tabs can watch the same test, and a page opened mid-test replays the samples so far. Cancel stops the engine promptly, closes the stream and resets the in-progress Prometheus gauge. Best-effort through reverse proxies: some setups (notably Cloudflare Access / Tunnel) buffer the stream until the test ends, so the chart only fills in at the end. Direct LAN access streams smoothly, and the final result and per-sample history are the same either way. - "Run now" button on the speed test card — idempotent. Kicks off a one-off test or attaches to one already in flight. Bypasses the "Disabled" schedule setting (Disabled governs scheduled tests, not manual runs).
- Engine: bundled
showwin/speedtest-go(pure Go, primary). Falls back to bundled Ookla CLI if the primary engine errors. Each historical row records which engine produced it; the dashboard caption next to the latest result showsvia {engine}, and a per-row engine column is exported via Prometheus + the snapshot API so you can correlate cross-engine measurements yourself. - Per-sample history — every test's per-sample throughput is persisted in a
speedtest_samplestable. Expand any past type=speed entry on/service-checksto see how throughput evolved during that test window. - Empty-state from history — fresh installs and cold-starts render the most-recent successful test from history with a "Last test: X ago" relative-time caption rather than waiting for the next cron tick.
- History chart of download and upload with 1H/1D/1W ranges. When the chosen range holds fewer than two tests, the chart widens to 24 hours, 7 days or 30 days and says so underneath.
- Schedule: once a day at 03:00 by default. Settings → Speed Test offers intervals from 30 minutes to once a month, with a time of day for daily, weekly and monthly runs, or Disabled for metered connections. Fresh installs also get an Internet Speed service check that reports the latest result and can compare it against your contracted speeds.
- Download, upload, latency and jitter, plus the server name, ISP and external IP.
Tunnel Monitoring
Automatic detection and monitoring of remote access tunnels:
- Cloudflared: Tunnel status — detects Docker containers out of the box, as long as the container name or image contains
cloudflare(unlike Tailscale, the match isn't configurable). A Docker-detected tunnel is up or down based on the container state (its connection count is just 1 or 0). With thecloudflaredCLI available and logged in, NAS Doctor readscloudflared tunnel listand reports the real number of active connectors per tunnel. Ingress routes are not collected. Host-binary detection requires a custom image that bundles thecloudflaredCLI (the default image bundlestailscalebut notcloudflared). - Tailscale: Full peer graph (online status, IPs, OS, relay regions, TX/RX bytes, exit node status) when the host daemon socket
/var/run/tailscaleis accessible via bind-mount. A plain-texttailscale statusfallback captures a reduced subset (IPs, hostnames, OS, online state) when JSON output is unavailable due to CLI-daemon version skew. When the daemon is unreachable the dashboard surfaces an actionable hint explaining what to mount. - Docker-container detection matches
tailscaleby default; opt-in env varNAS_DOCTOR_TAILSCALE_CONTAINER_NAMES=ts-sidecar,mullvad-ts,vpn(comma-separated, case-insensitive substring match) extends detection to custom-named sidecars. - Dashboard section in all themes with status dots per tunnel/peer
- Full coverage matrix across install methods (host binary, Docker, Kubernetes sidecar) in docs/tailscale-install-methods.md
Top Processes
Real-time process monitoring with Docker container attribution:
- Dashboard section — Top 10 processes ranked by CPU%, each tagged with its Docker container name via Linux cgroup matching
- Click-through — Click any process to jump to its CPU history chart on
/stats - Historical charts — Per-process CPU% time series on
/statswith 1H/1D/1W/1M range selector - Container attribution — Reads
/proc/PID/cgroupto match processes to Docker containers. Supports cgroup v1 (Unraid) and cgroup v2 (TrueNAS SCALE) - 5-minute collection — Process stats collected every 5 minutes alongside container stats
- Alert rules — Configurable
cpu_aboveandmem_abovethresholds per process
Requires
--pid=host(orpid: hostin compose) — without it, the container only sees its own processes.
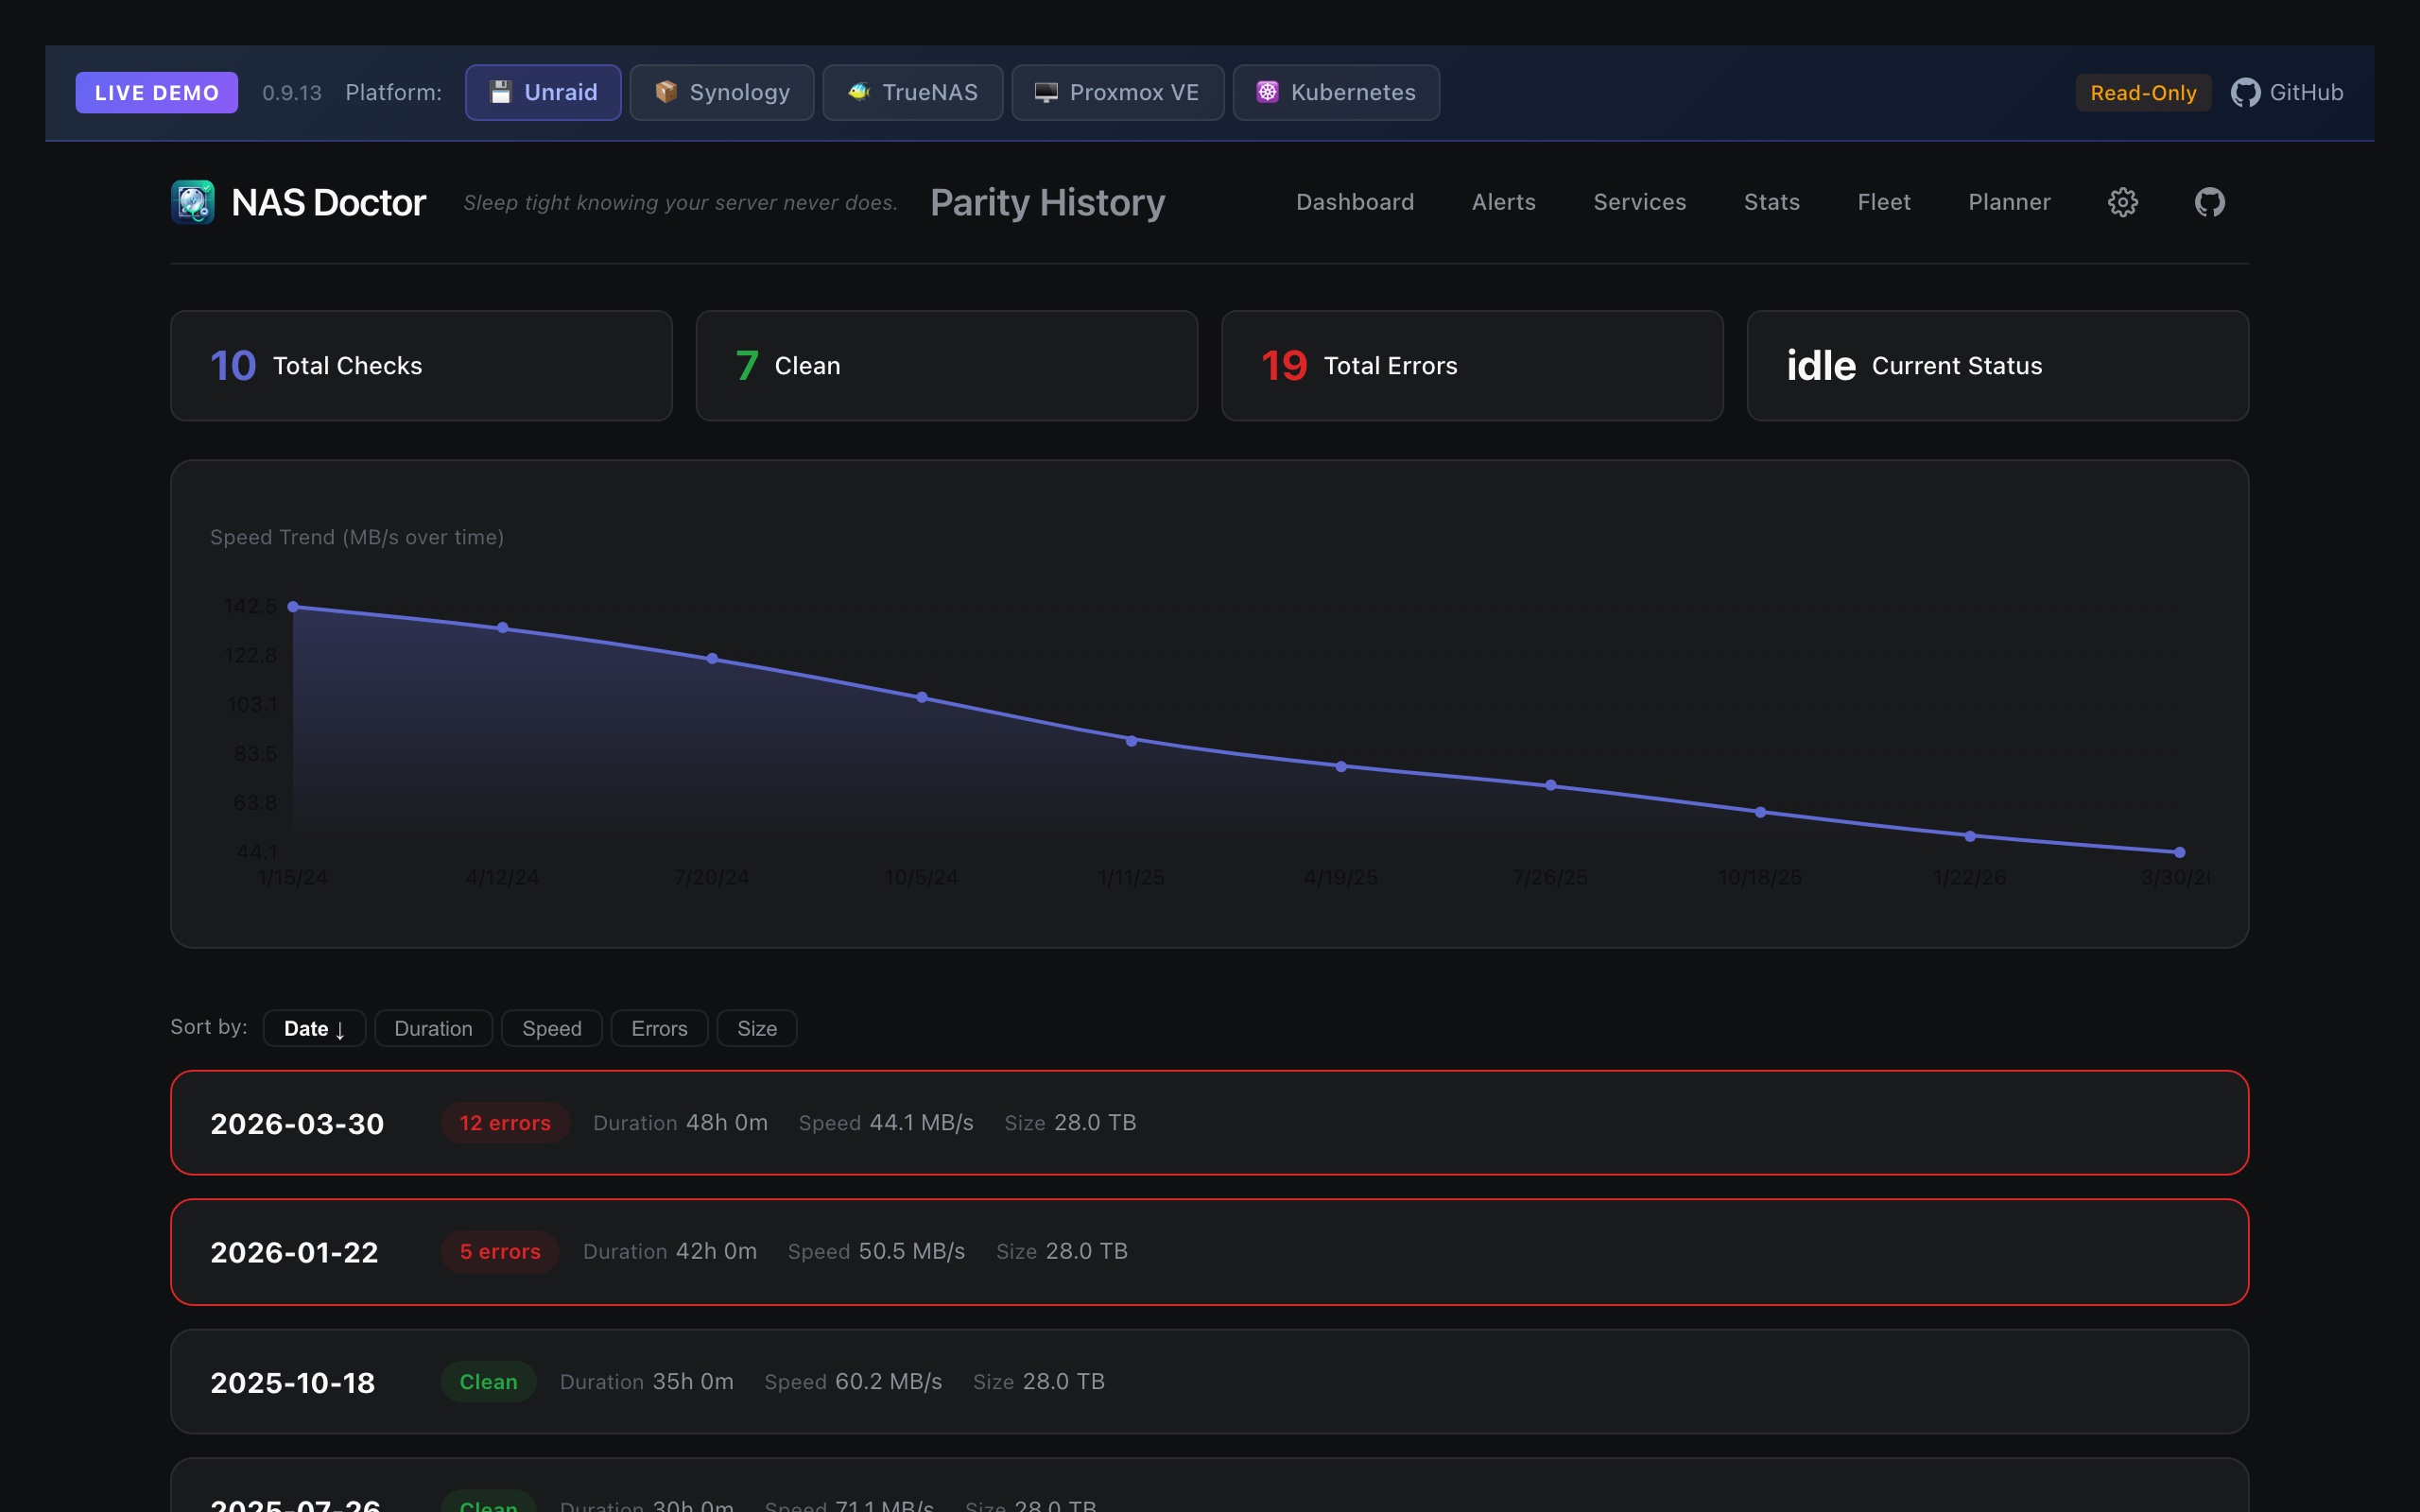
Parity Detail
Dedicated /parity page with full parity check history:
- Speed trend chart across all historical checks
- Expandable detail cards per check (duration, speed, errors, action, array size, exit code)
- Dashboard shows scrollable badge pills sorted newest-first (replaces the old table)
Notification Rules
Dropdown-driven notification builder with full granularity — no YAML, no complex policy syntax:
- 13 categories: Findings, Disk Space, Disk Temperature, SMART Health, Service Checks, Process, Parity, UPS/Power, Docker, System, ZFS, Tunnels, Platform Update
- Condition dropdowns that change per category — e.g., SMART offers "health fails", "reallocated above", "pending above", "CRC errors above", "power-on hours above"
- Target selection from live data — pick a specific drive, service, container, ZFS pool, or tunnel from a dropdown populated by the latest scan
- Threshold values — set exact numbers (e.g., disk space below 10%, temp above 55°C)
- 5 one-click presets: Critical alerts, Disk health watch, Service uptime, Power protection, Storage warnings
- Quiet Hours — suppress notifications during a daily time window (alerts still recorded)
- Maintenance Windows — scheduled suppression periods per hostname
- Default Cooldown — global deduplication window per rule
API Key Authentication
Per-instance API key system for securing fleet communication:
- Generate/Copy/Revoke from Settings — key format
nd-{uuid} - All
/api/v1/*endpoints protected when key is set (including/health) - Dashboard UI exempt (same-origin requests pass through)
- Fleet test validates end-to-end with API key before saving
- Docker HEALTHCHECK and K8s probes use TCP port check (no auth needed)
Multi-Server Fleet Monitoring
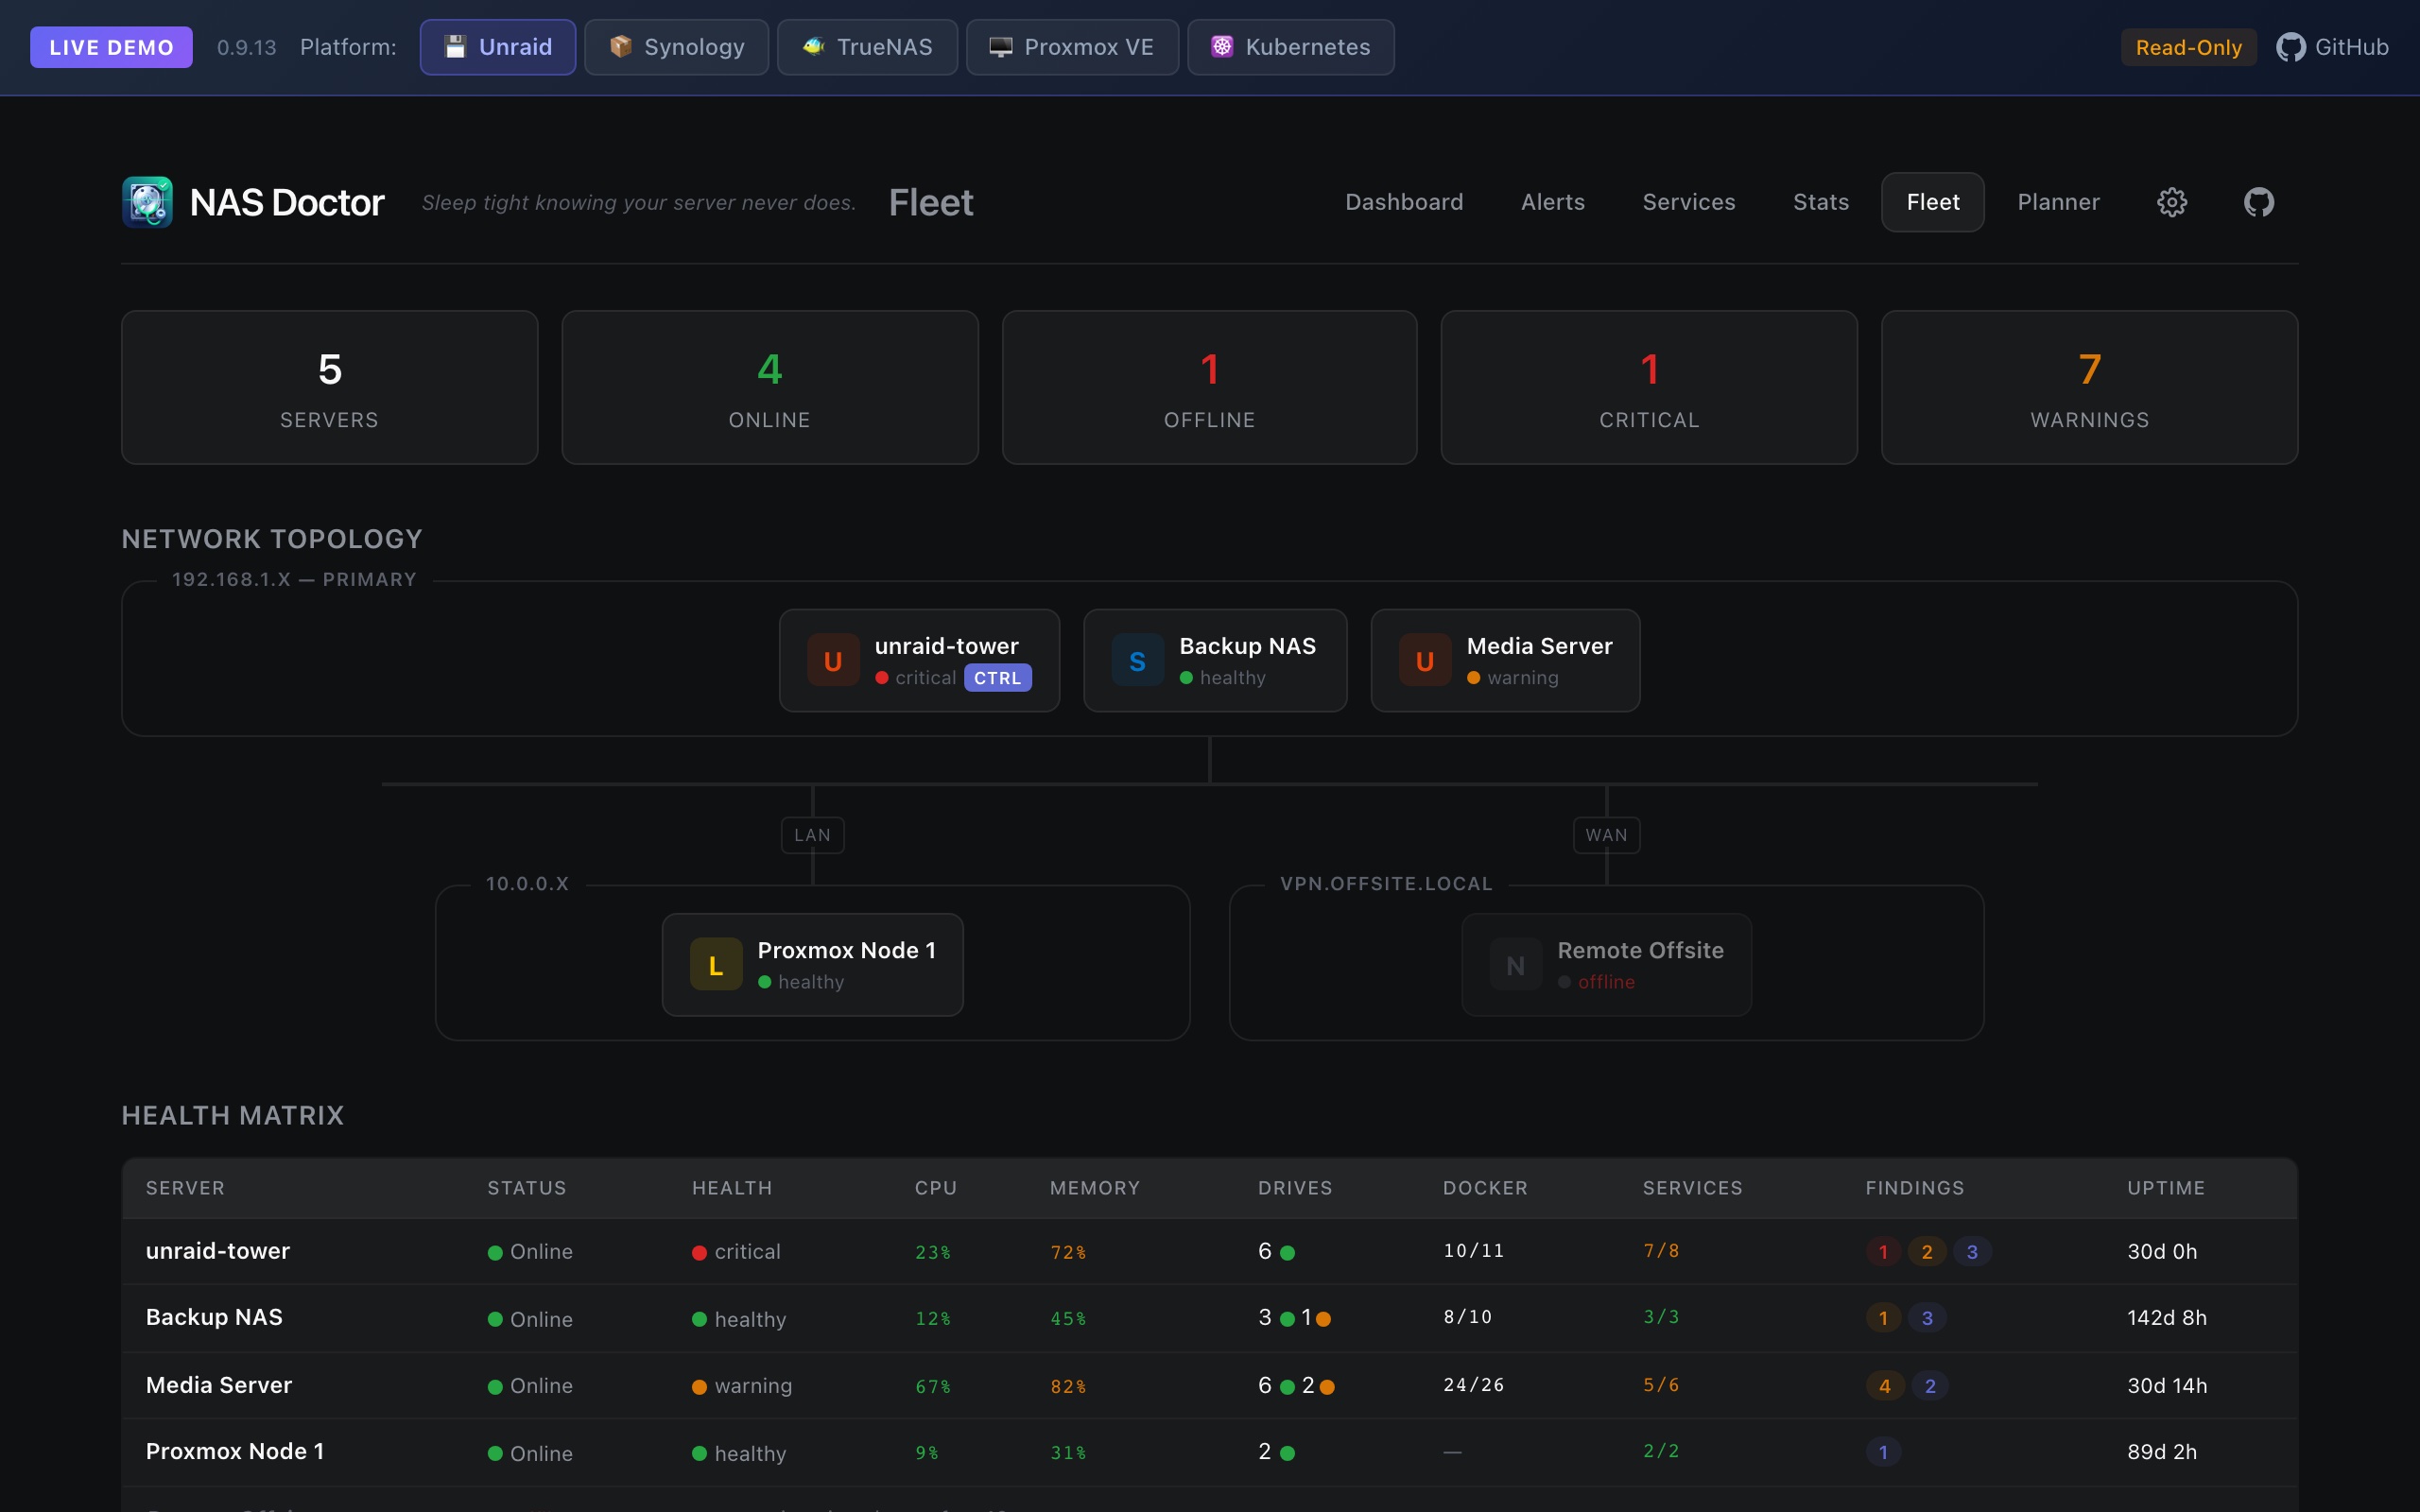
Monitor all your NAS Doctor instances from a visual topology view at /fleet:
- Visual topology with central primary node and connected remote servers
- Per-server: platform icon, hostname, IP, NAS Doctor version, uptime, health status, finding counts
- Connection type in the topology view: the
/fleetmap groups each remote server by its configured URL: RFC 1918 IPv4 andlocalhostas LAN (grouped by /24), raw Tailscale100.64.0.0/10IPs as Tailscale, hostnames containingcloudflareas Cloudflare Tunnel, anything else as WAN. MagicDNS names (*.ts.net) and custom domains behind a tunnel show as WAN. This is a display heuristic only; adding a server in Settings doesn't detect anything, and the local node is always placed in a192.168.1.xgroup whatever its real address - Custom auth headers per server for Cloudflare Access, Authelia, etc.
- Test Connection validates NAS Doctor signature + API key end-to-end
- Auto-create service check when adding a fleet server
- Edit/Remove per server with collapsible form
- Open Dashboard link to view remote instance directly
- API key required for fleet polling
Integrations
| Integration | How |
|---|---|
| Prometheus | Scrape /metrics — 120+ gauges for system (incl. CPU/mobo temps), disk, SMART, Docker, network, UPS, ZFS, GPU, services, parity, tunnels, Proxmox, Kubernetes, backup, speed test (incl. live-test in-progress + per-engine + per-sample-count gauges), findings |
| Grafana | Connect via Prometheus data source |
| Discord | Webhook with rich embeds, severity colors, finding details |
| Slack | Webhook with blocks, severity counts, top findings |
| Gotify | Native push notifications with priority mapping |
| Ntfy | Push notifications with priority and tags |
| Generic HTTP | JSON payload with HMAC-SHA256 signing for custom integrations |
Quick Start
Docker Compose (recommended)
services:
  nas-doctor:
    image: ghcr.io/mcdays94/nas-doctor:latest
    container_name: nas-doctor
    privileged: true          # Required for SMART access
    pid: host                 # Required for Top Processes (see host processes)
    network_mode: host
    volumes:
      - nas-doctor-data:/data
      - /var/run/docker.sock:/var/run/docker.sock:ro
      - /var/log:/host/log:ro
      - /dev:/dev:ro                       # SMART device access
      - /sys:/sys:ro                       # GPU telemetry
      # Mount your storage volumes (platform-specific):
      - /mnt:/host/mnt:ro                  # Unraid, TrueNAS
      # - /volume1:/host/volume1:ro        # Synology (add each volume)
      # - /volume2:/host/volume2:ro        # Synology
      # Unraid-specific (omit on other platforms):
      - /boot:/host/boot:ro
      - /etc/unraid-version:/etc/unraid-version:ro
      - /var/local/emhttp:/var/local/emhttp:ro  # Drive slot mapping (merged drive view)
      # Required IF you run Tailscale (any platform) and want the peer graph:
      - /var/run/tailscale:/var/run/tailscale:ro  # Tailscale peer detection via host daemon socket
    devices:
      - /dev/dri:/dev/dri                  # GPU monitoring (Intel/AMD)
    environment:
      - TZ=Europe/Lisbon
      - NAS_DOCTOR_INTERVAL=30m
    restart: unless-stopped

volumes:
  nas-doctor-data:
docker compose up -d
Then open http://your-nas:8060. See platform-specific sections below for Unraid, Synology, and TrueNAS configurations.
Unraid — Docker UI Setup
- Go to Docker tab → scroll down → Add Container
- Fill in the fields:
| Field | Value |
|---|---|
| Name | nas-doctor |
| Repository | ghcr.io/mcdays94/nas-doctor:latest |
| Icon URL | https://raw.githubusercontent.com/mcdays94/nas-doctor/main/icons/icon3.png |
| WebUI | http://[IP]:8060/ (if you change the listen port below, update this to match) |
| Network Type | Host |
| Privileged | On (required — SMART access needs raw device access) |
| Extra Parameters | --pid=host (required for Top Processes to see host processes) |
- Add these path mappings (click "Add another Path, Port, Variable..." for each):
| Name | Container Path | Host Path | Mode | Why |
|---|---|---|---|---|
| Data | /data |
/mnt/user/appdata/nas-doctor |
RW | Database, config, backups |
| Docker Socket | /var/run/docker.sock |
/var/run/docker.sock |
RO | Container monitoring |
| Boot Config | /host/boot |
/boot |
RO | Parity logs, Unraid ident |
| System Logs | /host/log |
/var/log |
RO | dmesg, syslog analysis |
| Host Mounts | /host/mnt |
/mnt |
RO | Per-disk space monitoring |
| Unraid Version | /etc/unraid-version |
/etc/unraid-version |
RO | OS update detection |
| Disk Slots | /var/local/emhttp |
/var/local/emhttp |
RO | Drive slot mapping for merged drive view |
| Device Nodes | /dev |
/dev |
RO | SMART and GPU device access |
| Sysfs | /sys |
/sys |
RO | GPU telemetry and drive mapping |
| Tailscale Socket | /var/run/tailscale |
/var/run/tailscale |
RO | Required if you use Tailscale for peer graph detection (tailscale-nas-util plugin OR network_mode: host Tailscale container). Leave blank if you don't use Tailscale. Without this mount the dashboard surfaces an "Unreachable" hint instead of peer data. |
- Add these variables:
| Key | Value |
|---|---|
TZ |
Your timezone (e.g. Europe/Lisbon, America/New_York) |
NAS_DOCTOR_LISTEN |
HTTP listen address, default :8060. Change to e.g. :8067 if port 8060 is in use. Bare port numbers also work (8067 is normalized to :8067 automatically). Because the container runs in host networking, this variable — not a Docker port mapping — is how the listen port is set. |
- Click Apply
Then open http://your-unraid-ip:8060 (or whichever port you set).
Important: Privileged mode and the Host Mounts volume (
/mnt:/host/mnt:ro) are required. Without privileged, SMART data won't work. Without/mnt, per-disk space won't show.Changing the port: Because the container uses host networking, the "Web UI Port" field in the template sets
NAS_DOCTOR_LISTEN(not a Docker port mapping). If you change it, also update the WebUI URL in Unraid (container settings → Advanced View → WebUI) so the icon opens the right port.
Synology DSM — Container Manager
Deploy via Container Manager (or Docker via SSH).
services:
  nas-doctor:
    image: ghcr.io/mcdays94/nas-doctor:latest
    container_name: nas-doctor
    privileged: true
    pid: host
    network_mode: host
    volumes:
      - /volume1/docker/nas-doctor:/data
      - /var/run/docker.sock:/var/run/docker.sock:ro
      - /var/log:/host/log:ro
      - /dev:/dev:ro                       # Required for SMART device access
      - /volume1:/host/volume1:ro
      - /volume2:/host/volume2:ro          # add more volumes as needed
    environment:
      - TZ=Europe/Lisbon
      - NAS_DOCTOR_INTERVAL=30m
    restart: unless-stopped
Then open http://your-synology-ip:8060.
Synology notes:
- Privileged mode is required for SMART access —
smartctlneeds raw device access viaSYS_RAWIOcapability- Mount
/dev:/dev:ro— Synology drive bays use/dev/sata*device nodes which must be visible to the container for SMART queries. NAS Doctor automatically tries SCSI-to-ATA translation (--device=sat) as a fallback- Mount each
/volume<#>you want monitored — Synology uses/volume1,/volume2, etc. instead of/mnt- There is no
/bootor/etc/unraid-versionon Synology — omit those mounts- Parity analysis is Unraid-specific and will be skipped automatically
- If SMART still shows warnings, try adding
cap_add: [SYS_RAWIO]explicitly
TrueNAS SCALE
Deploy via Apps or via SSH with Docker Compose.
services:
  nas-doctor:
    image: ghcr.io/mcdays94/nas-doctor:latest
    container_name: nas-doctor
    privileged: true
    pid: host
    network_mode: host
    volumes:
      - /mnt/pool/appdata/nas-doctor:/data
      - /var/run/docker.sock:/var/run/docker.sock:ro
      - /var/log:/host/log:ro
      - /mnt:/host/mnt:ro
      - /dev:/dev:ro                       # Required for SMART device access
      - /sys:/sys:ro                       # Required for GPU monitoring
    devices:
      - /dev/dri:/dev/dri                  # Intel/AMD GPU access (if applicable)
    environment:
      - TZ=America/New_York
      - NAS_DOCTOR_INTERVAL=30m
    restart: unless-stopped
Then open http://your-truenas-ip:8060.
TrueNAS notes:
- Privileged mode is required for SMART access
- Mount
/dev:/dev:rofor SMART device access and/sys:/sys:rofor GPU telemetry/dev/dridevice passthrough enables Intel iGPU monitoring (usage, temperature, power)- ZFS pool health, scrub status, ARC hit rate, and dataset listing work automatically
- Mount
/mntto see all pool/dataset storage usage- TrueNAS version is detected from
/etc/versionor/etc/os-release— no API auth needed- Parity analysis is Unraid-specific and will be skipped automatically
- UPS monitoring works if NUT is configured (TrueNAS has built-in NUT support)
Kubernetes (k3s / k8s)
Deploy via kubectl or GitOps (ArgoCD/Flux):
apiVersion: apps/v1
kind: Deployment
metadata:
  name: nas-doctor
  namespace: nas-doctor
spec:
  replicas: 1
  selector:
    matchLabels:
      app: nas-doctor
  template:
    spec:
      serviceAccountName: nas-doctor
      containers:
        - name: nas-doctor
          image: ghcr.io/mcdays94/nas-doctor:latest
          ports:
            - containerPort: 8060
          env:
            - name: TZ
              value: Europe/Lisbon
          volumeMounts:
            - name: data
              mountPath: /data
          livenessProbe:
            tcpSocket:
              port: 8060
      volumes:
        - name: data
          persistentVolumeClaim:
            claimName: nas-doctor-data
You'll also need a ServiceAccount + ClusterRole with read access to nodes, pods, deployments, services, namespaces, PVCs, and events. See the full K8s manifests for a complete example.
K8s notes:
- Enable In-cluster auto-detect in Settings → Kubernetes (uses mounted service account token)
- The
viewClusterRole is NOT sufficient — nodes are cluster-scoped. Use a custom ClusterRole- Multi-arch image: runs on amd64 and arm64 (Raspberry Pi) nodes
- No Docker socket needed — K8s integration uses the API directly
- Each node shows its
ephemeral-storagecapacity and allocatable amount from the node spec. NAS Doctor doesn't measure how full a node's disk is; real disk trouble surfaces as aDiskPressurenode finding- Services and PVCs are read but not listed on the dashboard; PVCs only appear as findings when Pending or Lost
Proxmox (via Ubuntu VM / LXC)
Deploy via Portainer or Docker Compose on a Proxmox VM:
services:
  nas-doctor:
    image: ghcr.io/mcdays94/nas-doctor:latest
    container_name: nas-doctor
    privileged: true
    pid: host
    network_mode: host
    restart: unless-stopped
    environment:
      - TZ=Europe/Lisbon
    volumes:
      - nas-doctor-data:/data
      - /var/log:/host/log:ro
      - /var/run/docker.sock:/var/run/docker.sock:ro

volumes:
  nas-doctor-data:
Then go to Settings → Proxmox VE, enter your PVE API URL (https://proxmox:8006), create an API token (Datacenter → Permissions → API Tokens, uncheck Privilege Separation), and click Test Connection.
Proxmox notes:
- Self-signed PVE certificates are accepted automatically
- Node filter dropdown auto-populated from Test Connection
- Display alias for friendly naming (e.g., "Proxmox LDN")
- Analyzer detects: node offline, memory critical, storage full, stale backups, HA errors, failed tasks
- SMART monitoring requires physical disk passthrough to the VM/LXC
Build from Source
git clone https://github.com/mcdays94/nas-doctor.git
cd nas-doctor
go build -o nas-doctor ./cmd/nas-doctor
./nas-doctor -listen :8060 -data ./data -interval 30m
For UI work without a NAS, ./nas-doctor -demo -listen :8060 serves the app with generated data. The screenshots below come from it.
Screenshots
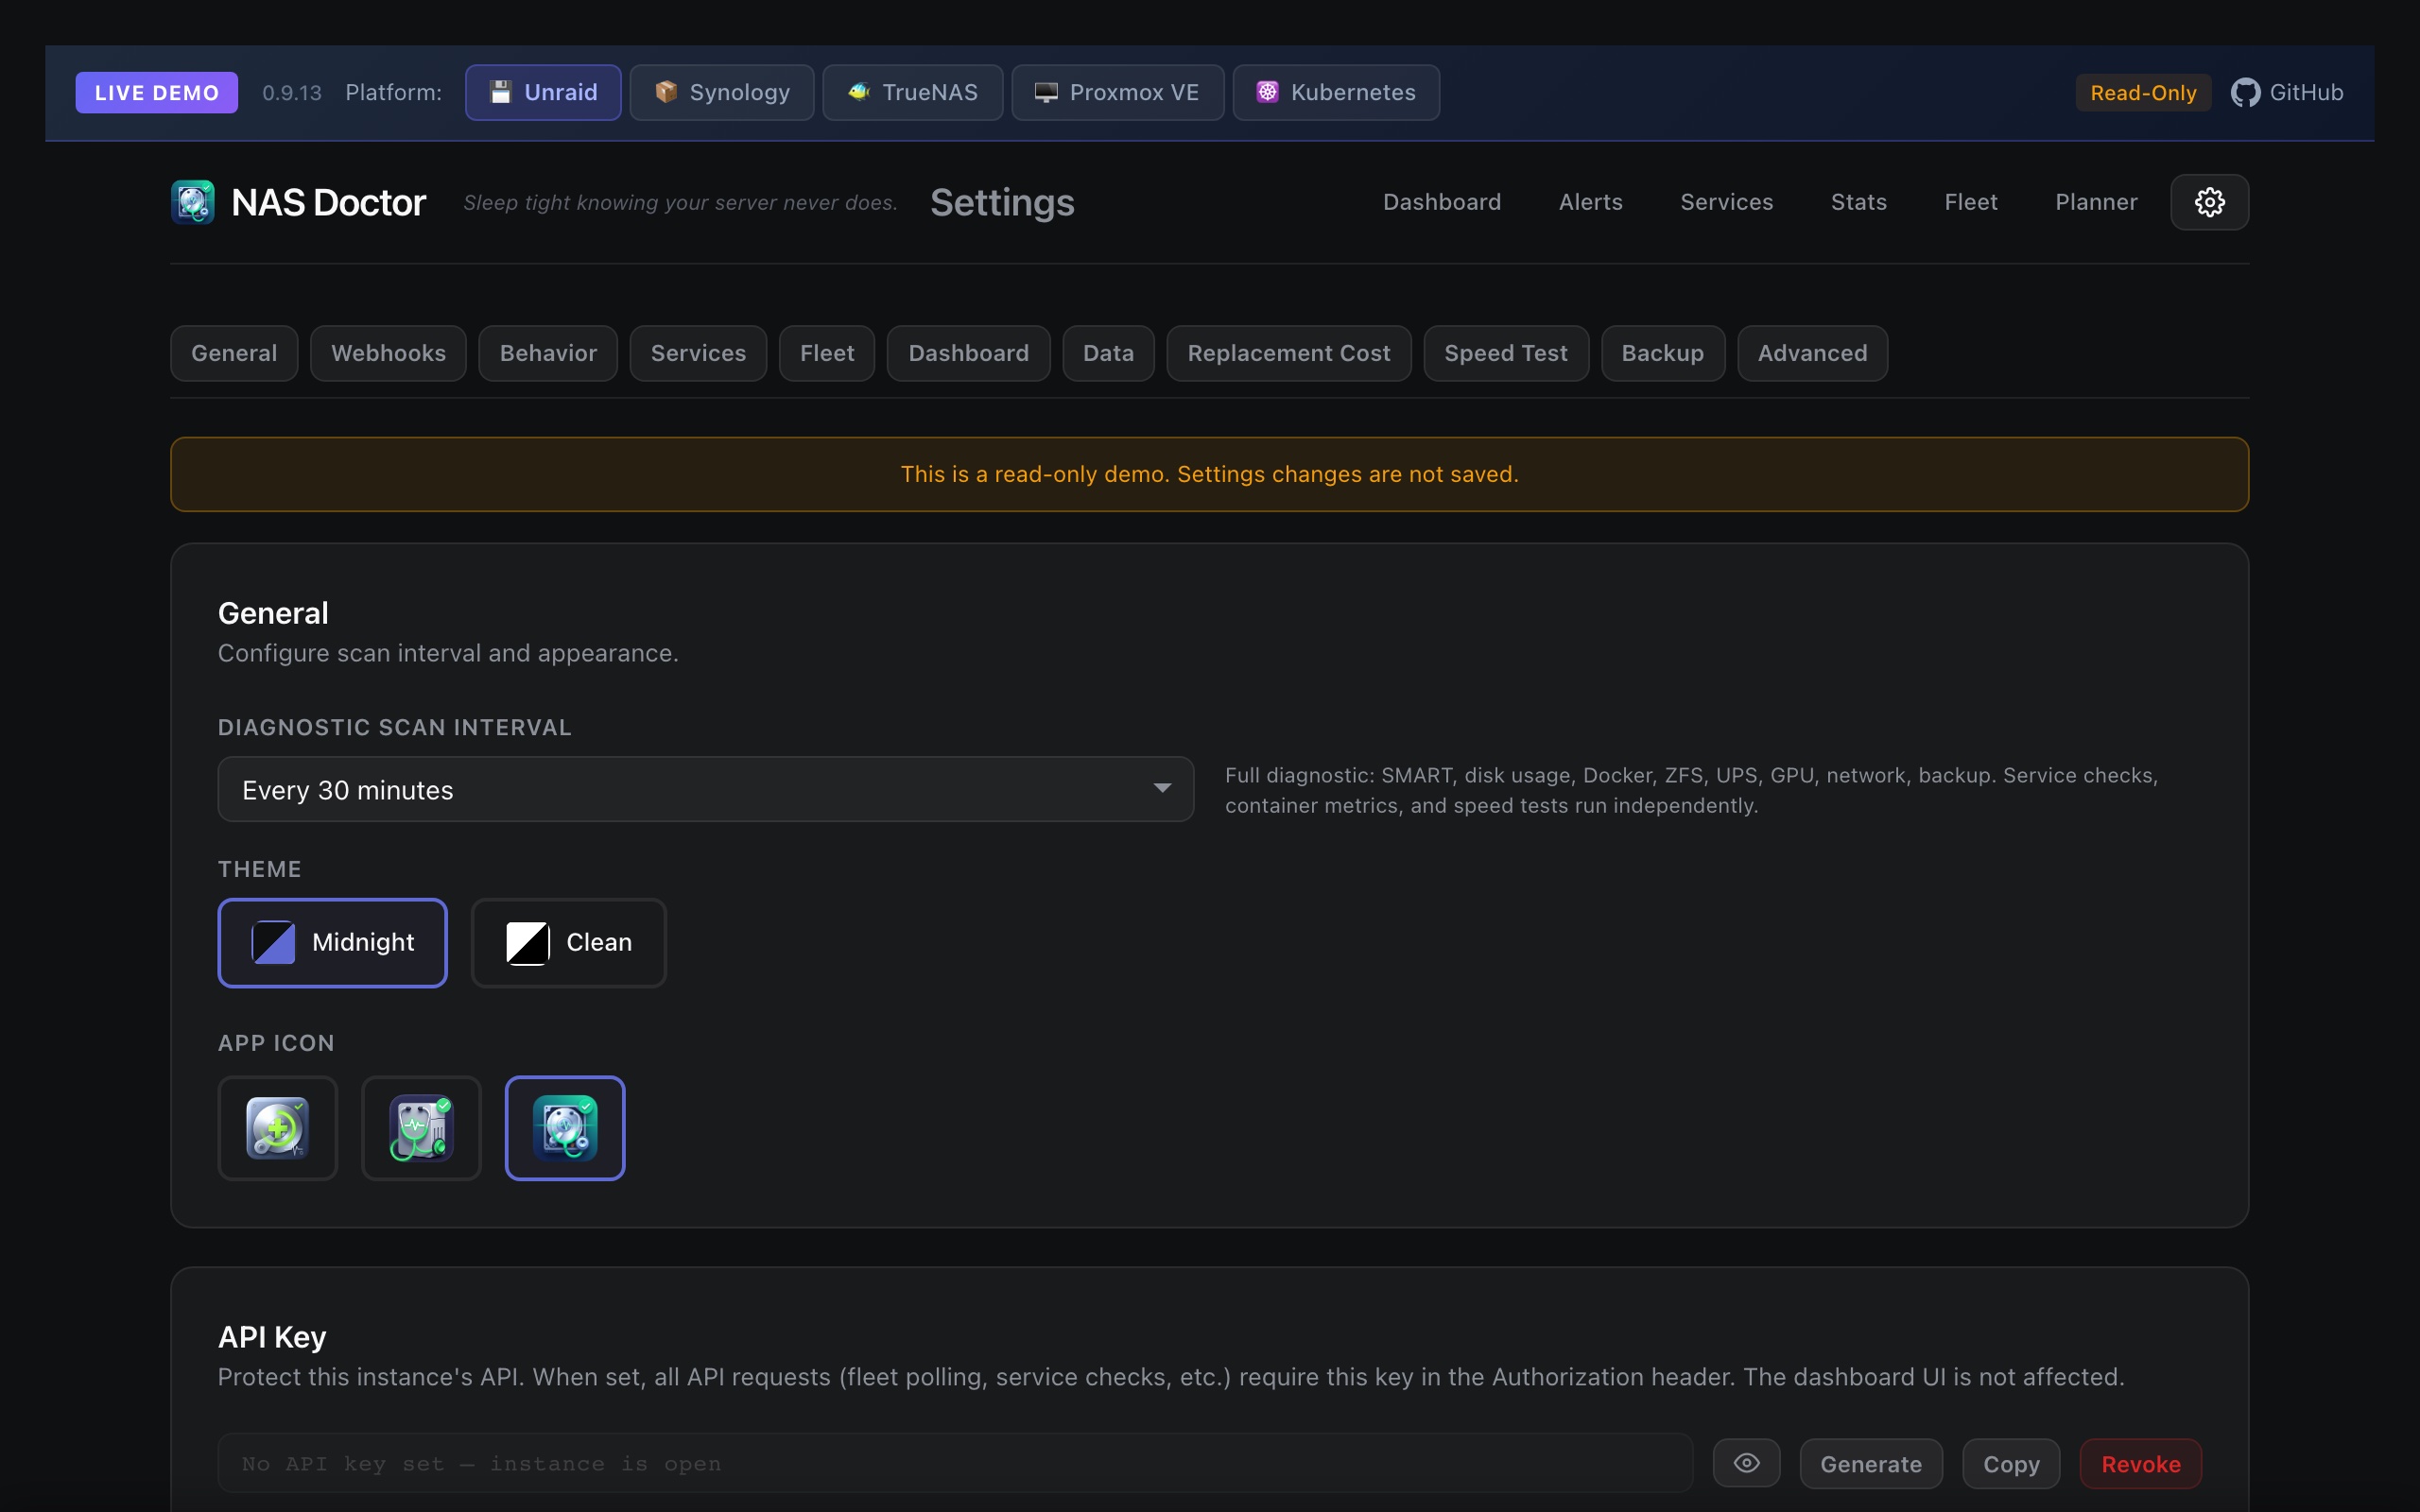
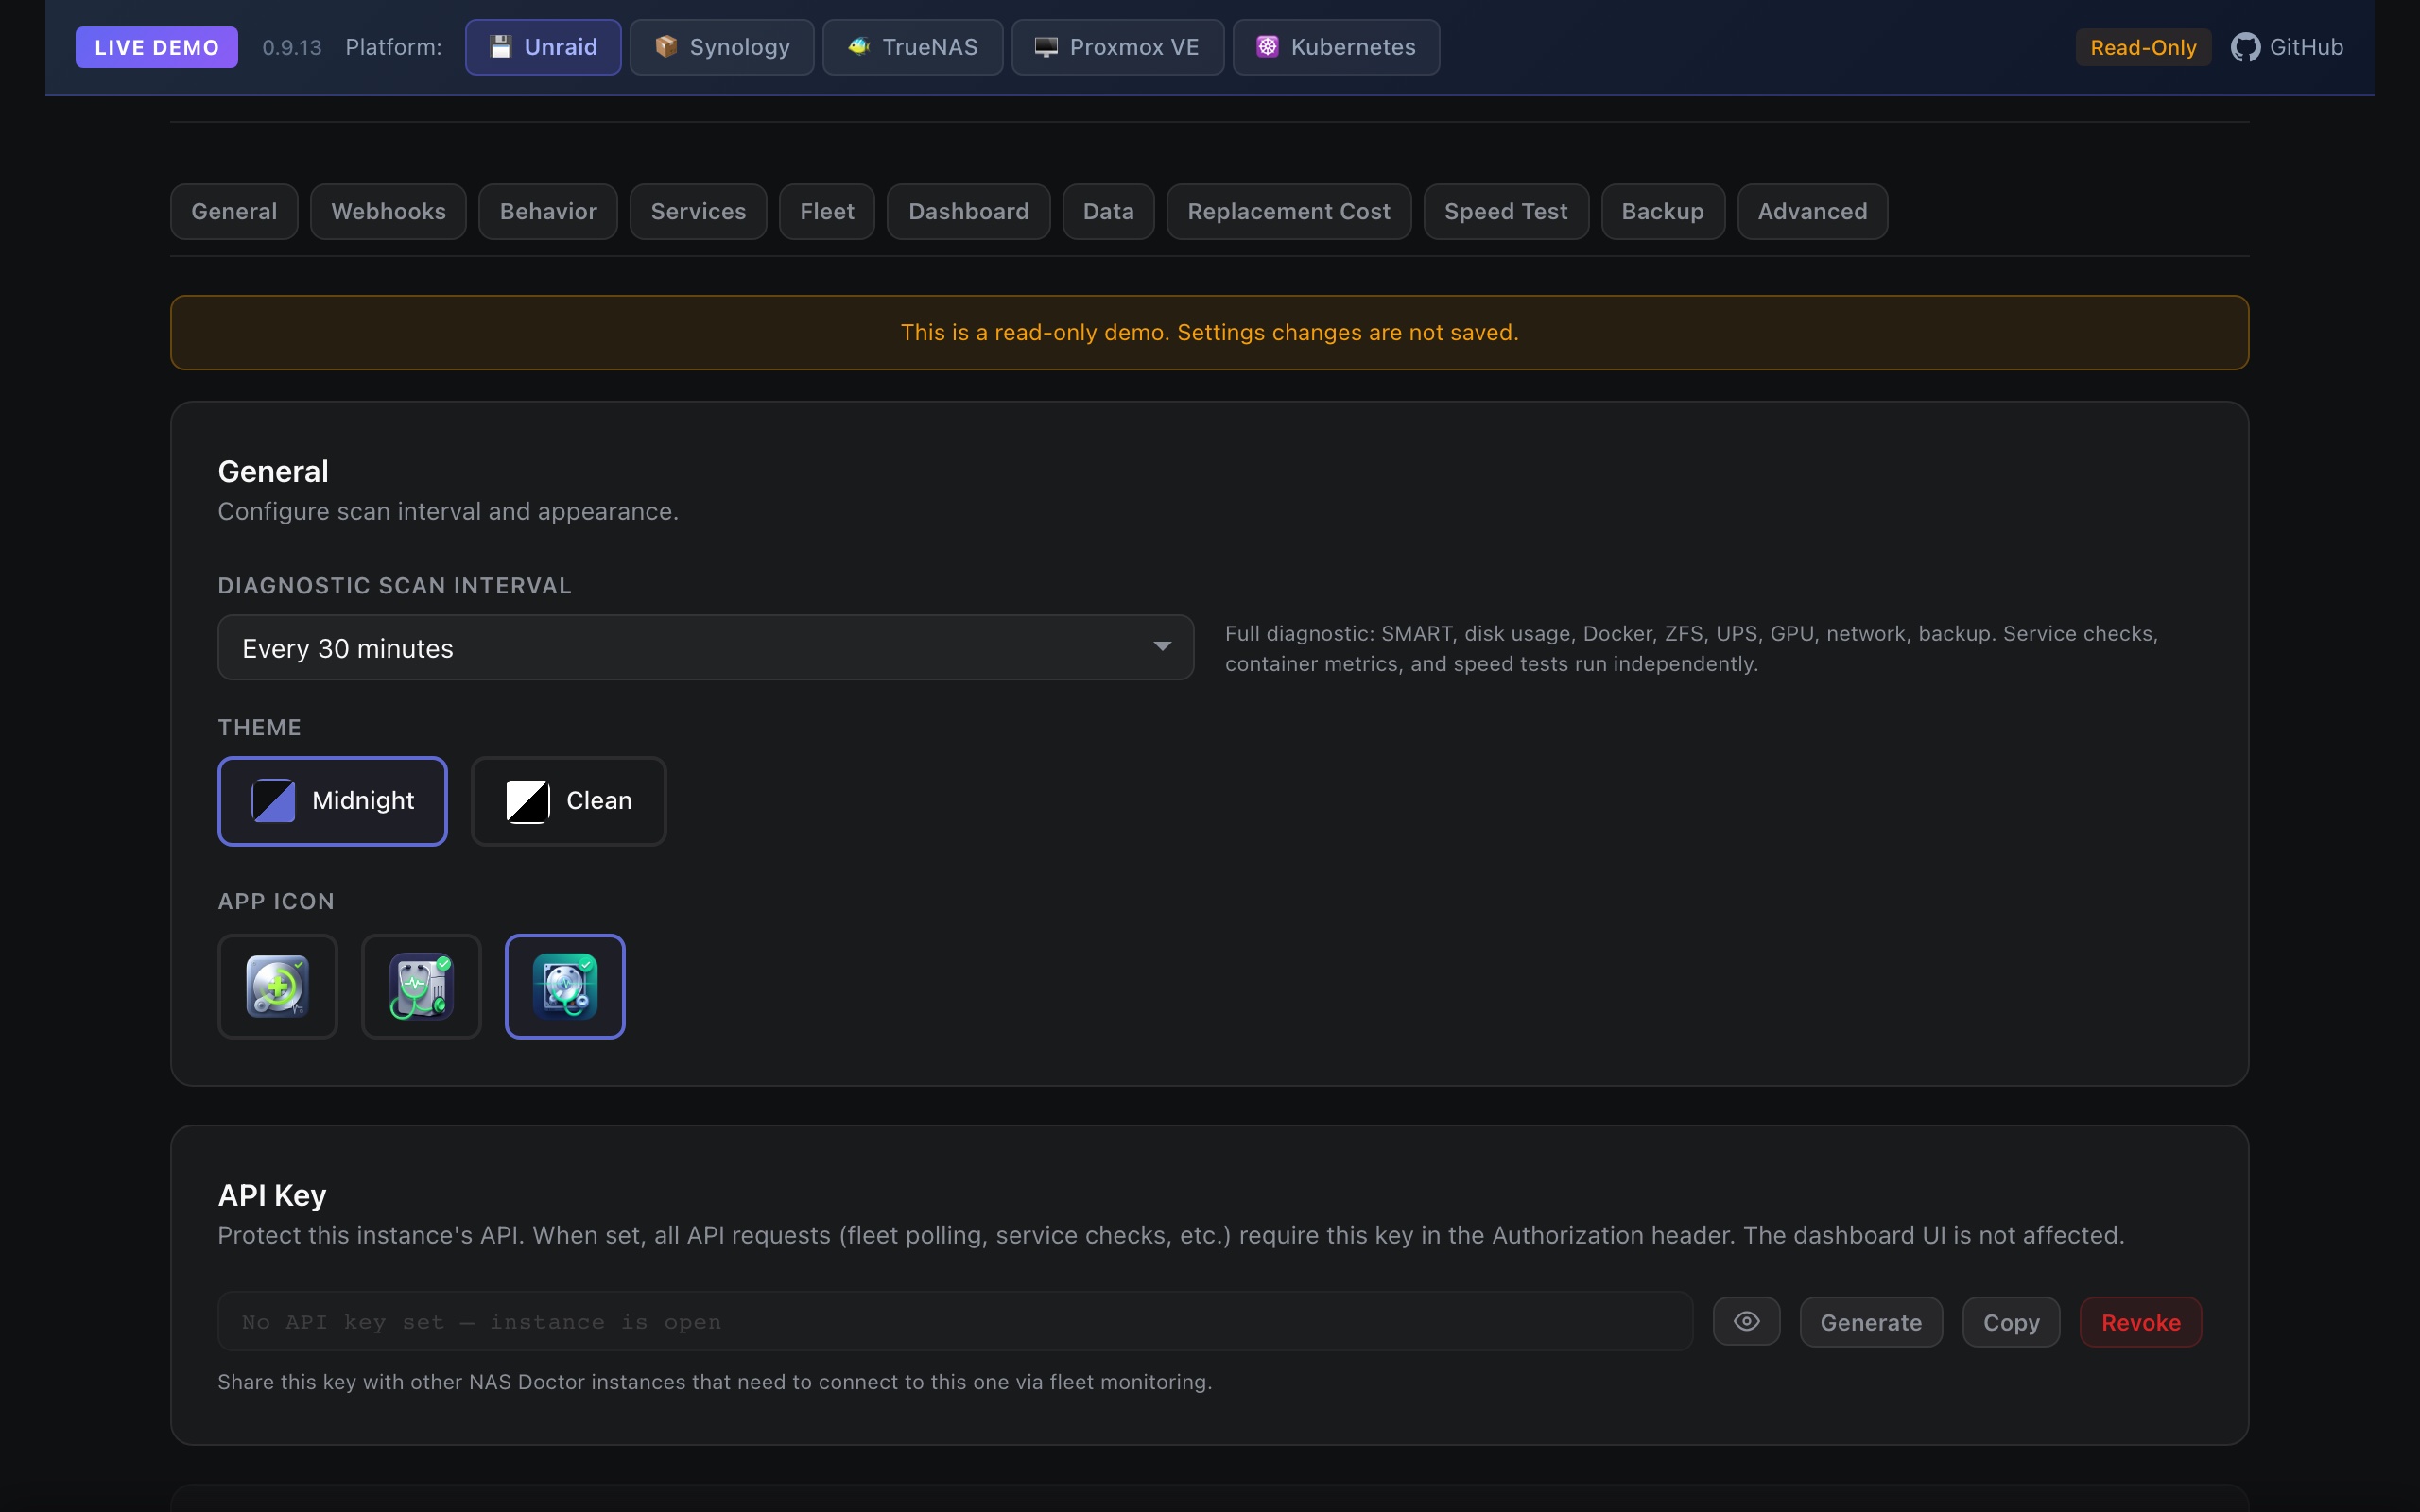
Captured from demo mode, which renders the UI with generated data.
Settings
All configurable from the web UI at /settings, organized with a sticky section nav:
- General: Scan interval (preset or custom with cron preview), theme selection, app icon
- API Key: Generate, copy or revoke the key that protects
/api/v1/* - Webhooks: Add/remove/test Discord, Slack, Gotify, Ntfy, or generic HTTP webhooks with optional custom headers and HMAC signing
- Notification Rules: Dropdown-driven rule builder with 13 categories, live target selection, threshold inputs, one-click presets, quiet hours, and maintenance windows
- Service Checks: HTTP, TCP, DNS, Ping/ICMP, SMB, NFS, Traceroute and Speed Test checks with per-check configurable intervals (30s–1h) and a Test button
- Proxmox VE and Kubernetes: API connection details with a connection test
- Log Forwarding: Forward scan results to Loki, syslog (UDP/TCP), or any HTTP JSON endpoint after each scan — with custom headers, labels, and payload format (full, findings only, summary)
- Data Lifecycle: Snapshot retention days, max DB size cap, notification log retention
- Drive Replacement Cost: Cost per TB used by the Replacement Planner's estimates
- Fleet: Add/remove remote NAS Doctor instances with optional API key auth
- Dashboard Sections: Toggle visibility of individual sections (SMART, Docker, ZFS, UPS, Parity, Network, Tunnels, etc.)
- Speed Test: When scheduled speed tests run (once a day at 03:00 by default), or Disabled
- Automatic Backup: Scheduled DB backups with configurable location, interval, and retention count
- Advanced: SMART scan controls (wake drives, max days without a SMART read), per-subsystem scan intervals, hidden Docker containers, and Borg / Duplicacy backup monitors
Environment Variables
| Variable | Default | Description |
|---|---|---|
NAS_DOCTOR_LISTEN |
:8060 |
HTTP listen address. Accepts :port, host:port, or bare port (normalized). |
NAS_DOCTOR_DATA |
/data |
SQLite database directory |
NAS_DOCTOR_INTERVAL |
30m |
Diagnostic scan interval |
NAS_DOCTOR_UPS_NAME |
(auto-detect) | NUT UPS name (skip auto-detect from upsc -l) |
NAS_DOCTOR_NUT_HOST |
(local) | Remote NUT server host (queries upsname@host) |
NAS_DOCTOR_APCUPSD_HOST |
(local) | Remote apcupsd daemon host:port |
NAS_DOCTOR_TAILSCALE_SOCKET |
/var/run/tailscale/tailscaled.sock |
Path to the Tailscale daemon socket inside the container |
NAS_DOCTOR_TAILSCALE_CONTAINER_NAMES |
(none) | Extra container names to treat as Tailscale, comma-separated, case-insensitive substring match (e.g. ts-sidecar,vpn) |
NAS_DOCTOR_HOST_LOG |
/host/log |
Where the host's /var/log is mounted in the container |
NAS_DOCTOR_HOST_BOOT |
/host/boot |
Where the host's /boot is mounted in the container (Unraid) |
NAS_DOCTOR_WEBHOOK_URL |
(none) | Adds a webhook at startup, alongside any configured in Settings |
NAS_DOCTOR_WEBHOOK_TYPE |
generic |
Type for that webhook: discord, slack, gotify, ntfy or generic |
NAS_DOCTOR_CONFIG |
(none) | Optional JSON config file loaded at startup (same as -config) |
TZ |
UTC |
Timezone |
API Reference
| Endpoint | Method | Description |
|---|---|---|
/api/v1/health |
GET | Healthcheck (status, version, uptime) |
/api/v1/status |
GET | Server status summary with section visibility |
/api/v1/snapshot/latest |
GET | Full latest diagnostic snapshot |
/api/v1/snapshot/{id} |
GET | Specific snapshot by ID |
/api/v1/snapshots |
GET | List recent snapshots |
/api/v1/scan |
POST | Trigger immediate diagnostic scan |
/api/v1/history/speedtest |
GET | Speed test history (query: ?hours=N) |
/api/v1/history/processes |
GET | Process CPU/memory history (query: ?hours=N) |
/api/v1/history/containers |
GET | Container stats history (query: ?hours=N) |
/api/v1/history/gpu |
GET | GPU metrics history (query: ?hours=N) |
/api/v1/settings |
GET/PUT | Read/write application settings |
/api/v1/settings/test-webhook |
POST | Send test notification to a webhook |
/api/v1/settings/chart-range |
PUT | Save the dashboard chart range (1, 24 or 168 hours) |
/api/v1/settings/section-order |
PUT | Save the dashboard section layout |
/api/v1/settings/section-heights |
PUT | Save dashboard section heights |
/api/v1/proxmox/test |
POST | Test a Proxmox VE API connection |
/api/v1/kubernetes/test |
POST | Test a Kubernetes API connection |
/api/v1/backup-monitor/borg/test |
POST | Probe a Borg repo config |
/api/v1/backup-monitor/duplicacy/test |
POST | Probe a Duplicacy repo or cache config |
/api/v1/icons |
GET | Available app icons and the default |
/api/v1/sparklines |
GET | Condensed system + SMART history for charts |
/api/v1/history/system |
GET | System metrics history (CPU, memory, I/O) |
/api/v1/disks |
GET | List all drives with SMART data |
/api/v1/disks/{serial} |
GET | Per-drive detail with full SMART history |
/api/v1/disk-usage-history |
GET | Disk usage history per mount |
/api/v1/capacity-forecast |
GET | Fill-rate forecast per mount |
/api/v1/replacement-plan |
GET | Drive replacement plan (urgency, risk factors, cost) |
/api/v1/alerts |
GET | List alerts (filterable by status) |
/api/v1/alerts/{id} |
GET | Get single alert detail |
/api/v1/alerts/{id}/events |
GET | Alert lifecycle timeline events |
/api/v1/alerts/{id}/ack |
POST | Acknowledge an alert |
/api/v1/alerts/{id}/unack |
POST | Unacknowledge an alert |
/api/v1/alerts/{id}/snooze |
POST | Snooze an alert (with until timestamp) |
/api/v1/alerts/{id}/unsnooze |
POST | Unsnooze an alert |
/api/v1/incidents/timeline |
GET | Incident timeline with system metrics overlay |
/api/v1/incidents/correlation |
GET | Alert correlation (before/during/after metrics) |
/api/v1/smart/trends |
GET | SMART degradation trends with risk scoring |
/api/v1/notifications/log |
GET | Webhook delivery history |
/api/v1/service-checks |
GET | Latest service check results |
/api/v1/service-checks/history |
GET | Service check result history |
/api/v1/service-checks/run |
POST | Trigger service checks immediately |
/api/v1/service-checks/test |
POST | Run a check config once without saving it |
/api/v1/service-checks/test-stream |
POST | Same as /test, streamed as Server-Sent Events for traceroute and speed checks (live hops or samples, then the result) |
/api/v1/service-checks/{key} |
DELETE | Remove a check's stored history |
/api/v1/speedtest/run |
POST | Start a speed test (or attach to one in flight). Idempotent — returns {test_id, started_at, engine} |
/api/v1/speedtest/stream/{test_id} |
GET | Server-Sent Events stream of a live test's progress. Event types: start, phase_change, sample, result, cancelled, error, end |
/api/v1/speedtest/cancel/{test_id} |
POST | Cancel a running speed test |
/api/v1/speedtest/samples/{test_id} |
GET | JSON array of per-sample throughput readings for a completed test (used by the expanded-log mini-chart on /service-checks) |
/api/v1/findings/dismiss |
POST | Dismiss a finding from the dashboard |
/api/v1/findings/restore |
POST | Restore a dismissed finding |
/api/v1/db/stats |
GET | Database size and row counts |
/api/v1/backup |
GET/POST | List or trigger database backup |
/api/v1/fleet |
GET | Aggregated status of all remote servers |
/service-checks |
GET | Service checks dashboard (HTML) |
/parity |
GET | Parity history detail page (HTML) |
/api/v1/fleet/servers |
GET/PUT | Manage remote server list |
/api/v1/fleet/test |
POST | Test connectivity to a remote server |
/metrics |
GET | Prometheus metrics endpoint |
Prometheus Metrics
All metrics prefixed with nasdoctor_. Full list:
Expand metric list (120+ metrics)
# System (14 gauges)
nasdoctor_system_cpu_usage_percent / _cpu_cores
nasdoctor_system_memory_used_bytes / _total_bytes / _used_percent
nasdoctor_system_swap_used_bytes / _total_bytes
nasdoctor_system_load_avg_1 / _5 / _15
nasdoctor_system_io_wait_percent / _uptime_seconds
nasdoctor_system_cpu_temp_celsius / _mobo_temp_celsius   # 0 when no sensor available

# Disks (labels: device, mountpoint, label)
nasdoctor_disk_used_bytes / _total_bytes / _used_percent

# SMART (labels: device, model, serial) — 11 gauges per drive
nasdoctor_smart_healthy / _temperature_celsius / _temperature_max_celsius
nasdoctor_smart_reallocated_sectors / _pending_sectors / _offline_uncorrectable
nasdoctor_smart_udma_crc_errors / _command_timeout / _spin_retry_count
nasdoctor_smart_power_on_hours / _size_bytes

# Docker (labels: name, image)
nasdoctor_docker_container_cpu_percent / _memory_bytes / _running
nasdoctor_docker_container_count

# Network (labels: interface)
nasdoctor_network_interface_up / _mtu

# UPS (10 gauges)
nasdoctor_ups_battery_percent / _battery_voltage
nasdoctor_ups_input_voltage / _output_voltage / _load_percent
nasdoctor_ups_runtime_minutes / _wattage_watts / _temperature_celsius
nasdoctor_ups_on_battery / _low_battery

# ZFS (labels: pool for pools, dataset+pool for datasets)
nasdoctor_zfs_pool_healthy / _used_bytes / _total_bytes / _used_percent
nasdoctor_zfs_pool_fragmentation_percent / _scan_percent / _scan_errors
nasdoctor_zfs_pool_read_errors / _write_errors / _checksum_errors
nasdoctor_zfs_arc_size_bytes / _max_size_bytes / _hit_rate_percent
nasdoctor_zfs_arc_hits_total / _misses_total
nasdoctor_zfs_l2arc_size_bytes / _hit_rate_percent
nasdoctor_zfs_dataset_used_bytes / _avail_bytes / _compression_ratio

# Service Checks (labels: name, type, target)
nasdoctor_service_up / _response_ms / _consecutive_failures

# Parity (Unraid)
nasdoctor_parity_speed_mb_per_sec / _duration_seconds / _errors / _running

# Tunnels
nasdoctor_tunnel_cloudflared_up / _connections (labels: name)
nasdoctor_tunnel_tailscale_node_online / _tx_bytes / _rx_bytes (labels: name, ip)

# Proxmox (labels: node / vmid+name+type+node / storage+node+type)
nasdoctor_proxmox_node_cpu_usage / _memory_used_bytes / _memory_total_bytes / _node_online
nasdoctor_proxmox_guest_cpu_usage / _memory_used_bytes / _memory_max_bytes / _guest_running
nasdoctor_proxmox_storage_used_bytes / _storage_total_bytes

# Kubernetes (labels: node / pod+namespace / deployment+namespace)
nasdoctor_k8s_node_ready / _node_pod_count
nasdoctor_k8s_pod_running / _pod_restarts
nasdoctor_k8s_deployment_ready_replicas / _deployment_desired_replicas

# GPU (labels: index, name, vendor) — 10 gauges per GPU
nasdoctor_gpu_usage_percent / _mem_used_mb / _mem_total_mb / _mem_percent
nasdoctor_gpu_temperature_celsius / _power_watts / _power_max_watts / _fan_percent
nasdoctor_gpu_encoder_percent / _decoder_percent

# Backup (labels: provider, name)
nasdoctor_backup_last_success_timestamp / _size_bytes / _status

# Backup — Duplicacy (labels: label, +reason on _status) — 4 gauges per entry
nasdoctor_backup_duplicacy_snapshots_total{label="…"}
nasdoctor_backup_duplicacy_last_backup_age_seconds{label="…"}     # resolves at scrape time, monotonic between scans
nasdoctor_backup_duplicacy_last_backup_size_bytes{label="…"}
nasdoctor_backup_duplicacy_status{label="…",reason="…"}           # 1 for current reason, 0 for others (8-reason closed set)

# Speed Test
nasdoctor_speedtest_download_mbps / _upload_mbps / _latency_ms
nasdoctor_speedtest_in_progress                            # 1 while a test is running
nasdoctor_speedtest_engine{engine="speedtest_go|ookla_cli"}  # 1 for the engine of the most-recent successful test
nasdoctor_speedtest_samples_count{test_id="..."}           # sample count of the most-recent completed test

# Findings
nasdoctor_findings_critical_count / _warning_count
nasdoctor_findings_total{severity="critical|warning|info"}

# Other
nasdoctor_update_available
nasdoctor_collection_duration_seconds / _last_collection_timestamp
Supported Platforms
| Platform | Status | Notes |
|---|---|---|
| Unraid | ✅ Tested | Parity analysis, array status, disk labels, OS update check; dogfooded daily |
| Synology DSM | ⚠️ Community tested | /volume<#> detection, /dev/mapper/cachedev_* support, SMART health parsing |
| TrueNAS SCALE | ⚠️ Untested | ZFS pool health support built-in, but not yet validated on real hardware |
| Proxmox VE | ⚠️ Community tested | PVE REST API integration with cluster + node + VM/LXC views; dogfooded as a fleet peer |
| Kubernetes (k3s / k8s) | ⚠️ Community tested | In-cluster auto-detection, ServiceAccount + ClusterRole auth; tested on k3s |
| QNAP QTS | ⚠️ Untested | Should work via Container Station |
| Generic Linux | ⚠️ Untested | Any distro with Docker |
Tested on Unraid daily. Synology, Proxmox, and Kubernetes have community reports / fleet-peer dogfooding. Other platforms should work but may have edge cases with disk detection, SMART access, or platform-specific features. Report issues here.
A note from the maintainer
NAS Doctor is maintained by one person, and the only platform I have hands-on every day is Unraid. Synology DSM, TrueNAS SCALE, Proxmox VE, Kubernetes/k3s, and Docker-on-Linux are all supported and tested via emulation, captured-snapshot replay, and a couple of community fleet peers — but bugs that would be obvious to me on a box I can poke with my hands tend to surface only when a non-Unraid user reports them.
If you're running NAS Doctor on Synology, TrueNAS, Proxmox, Kubernetes, or any other non-Unraid host and something looks off — please open an issue. Even small UX oddities are useful: "the drive merge view lists my volume twice", "the Proxmox containers widget shows VMs instead of LXCs", "the UPS section is empty even though apcupsd is running". Your reports are how this project stays honest across platforms — they're appreciated, not a burden.
File Structure & Data Locations
Inside the container (/data volume)
/data/
├── nas-doctor.db          # SQLite database (snapshots, alerts, history, settings)
└── backups/               # Automatic DB backups (configurable)
    ├── nas-doctor-2026-04-10.db
    └── ...
All configuration is stored in the SQLite database and managed via the web UI at /settings. There are no config files to edit manually.
Host bind mounts (read-only)
All bind mounts in one place — match the per-platform Quick Start tables above. Mount only what applies to your platform; everything is RO except /data.
| Container path | Host path | Purpose |
|---|---|---|
/host/mnt |
/mnt |
Disk space monitoring (Unraid, TrueNAS, Proxmox) |
/host/volume<N> |
/volume<N> |
Disk space monitoring (Synology — mount each volume) |
/host/log |
/var/log |
System log analysis (dmesg, syslog) |
/host/boot |
/boot |
Parity logs, Unraid identification (Unraid only) |
/etc/unraid-version |
/etc/unraid-version |
Unraid OS detection + update check (Unraid only) |
/var/local/emhttp |
/var/local/emhttp |
Unraid drive slot mapping for merged drive view (Unraid only) |
/dev |
/dev |
SMART and GPU device access |
/sys |
/sys |
GPU telemetry and drive mapping |
/var/run/docker.sock |
/var/run/docker.sock |
Container monitoring (auto-detect Docker) |
/var/run/tailscale |
/var/run/tailscale |
Tailscale peer graph (mount only if you use Tailscale on the host) |
External Borg repos add their own bind-mount entries on top of the table — see External Borg Monitoring (host-managed repos) above for repo-path mount conventions and required env vars.
Duplicacy entries also add bind-mount entries (one per repo or cache root, Read Only — disk-read makes RO mounts safe). See Duplicacy Monitoring (disk-read, no binary required) above. No env vars required, no binary mount, no extra Docker capability.
Source tree
cmd/nas-doctor/            # Entry point, CLI flags, demo mode
internal/
├── analyzer/              # Diagnostic rules engine, Backblaze thresholds
├── api/                   # HTTP handlers, embedded HTML templates, shared CSS
│   └── templates/         # Dashboard themes (midnight, clean) + subpages
├── collector/             # Data collection (SMART, disk, docker, network, UPS, tunnels, sensors)
├── demo/                  # Mock data generation for demo mode
├── fleet/                 # Multi-server fleet polling
├── livetest/              # In-flight speed-test broadcast registry (SSE fan-out + replay)
├── logfwd/                # Log forwarding (Loki, HTTP JSON, syslog)
├── notifier/              # Webhook delivery + Prometheus exporter
├── scheduler/             # Scan scheduling, notification rules, service checks
└── storage/               # SQLite database layer
Resource Usage
NAS Doctor is designed to be invisible on your system:
| Resource | During scan (~15s every 30m) | Between scans |
|---|---|---|
| CPU | <2% | ~0% |
| Memory | ~30-50 MB | ~30-50 MB |
| Disk I/O | Read-only: /proc, smartctl, dmesg |
Zero |
| Network | OS update check (1 req/day) | Serves UI only when accessed |
Diagnostic Report
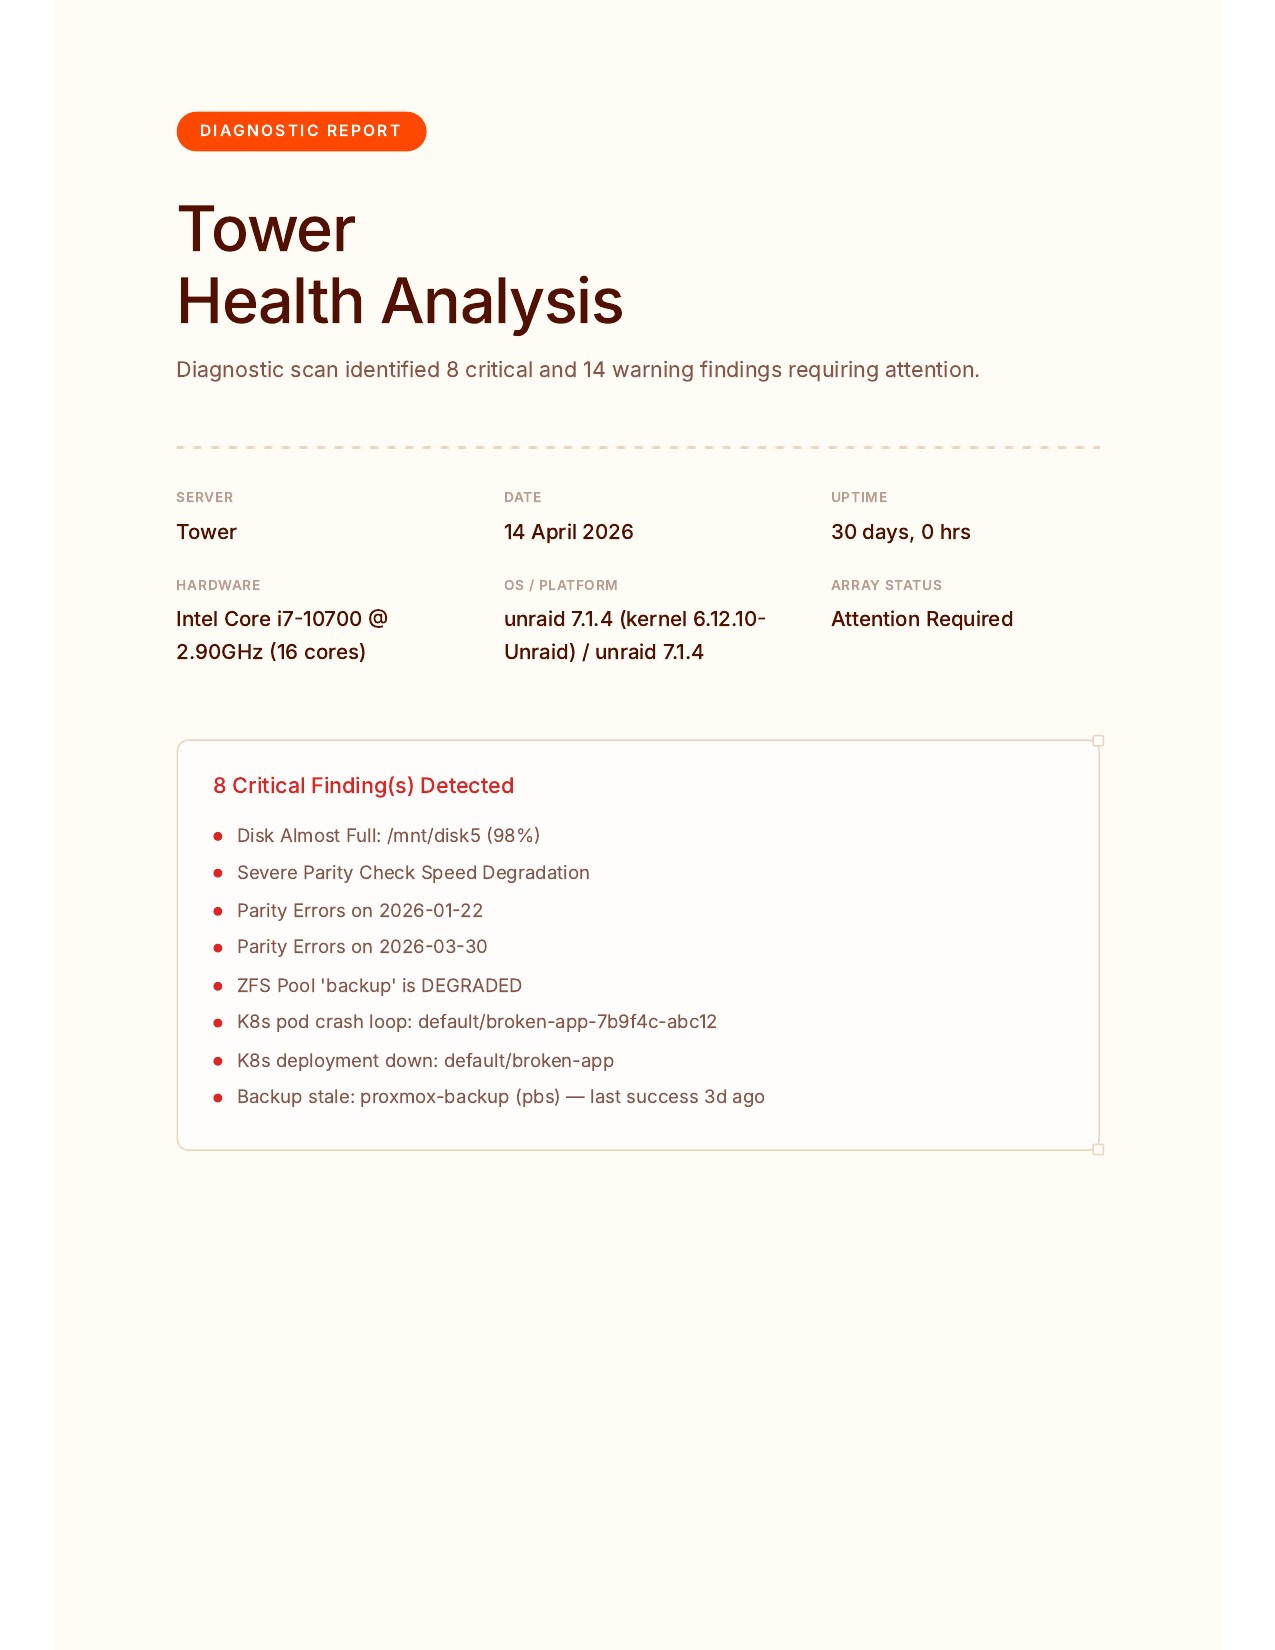
Click Export Report on the dashboard to generate a print-ready diagnostic report. Open in your browser and use Print > Save as PDF. View a sample report (PDF).
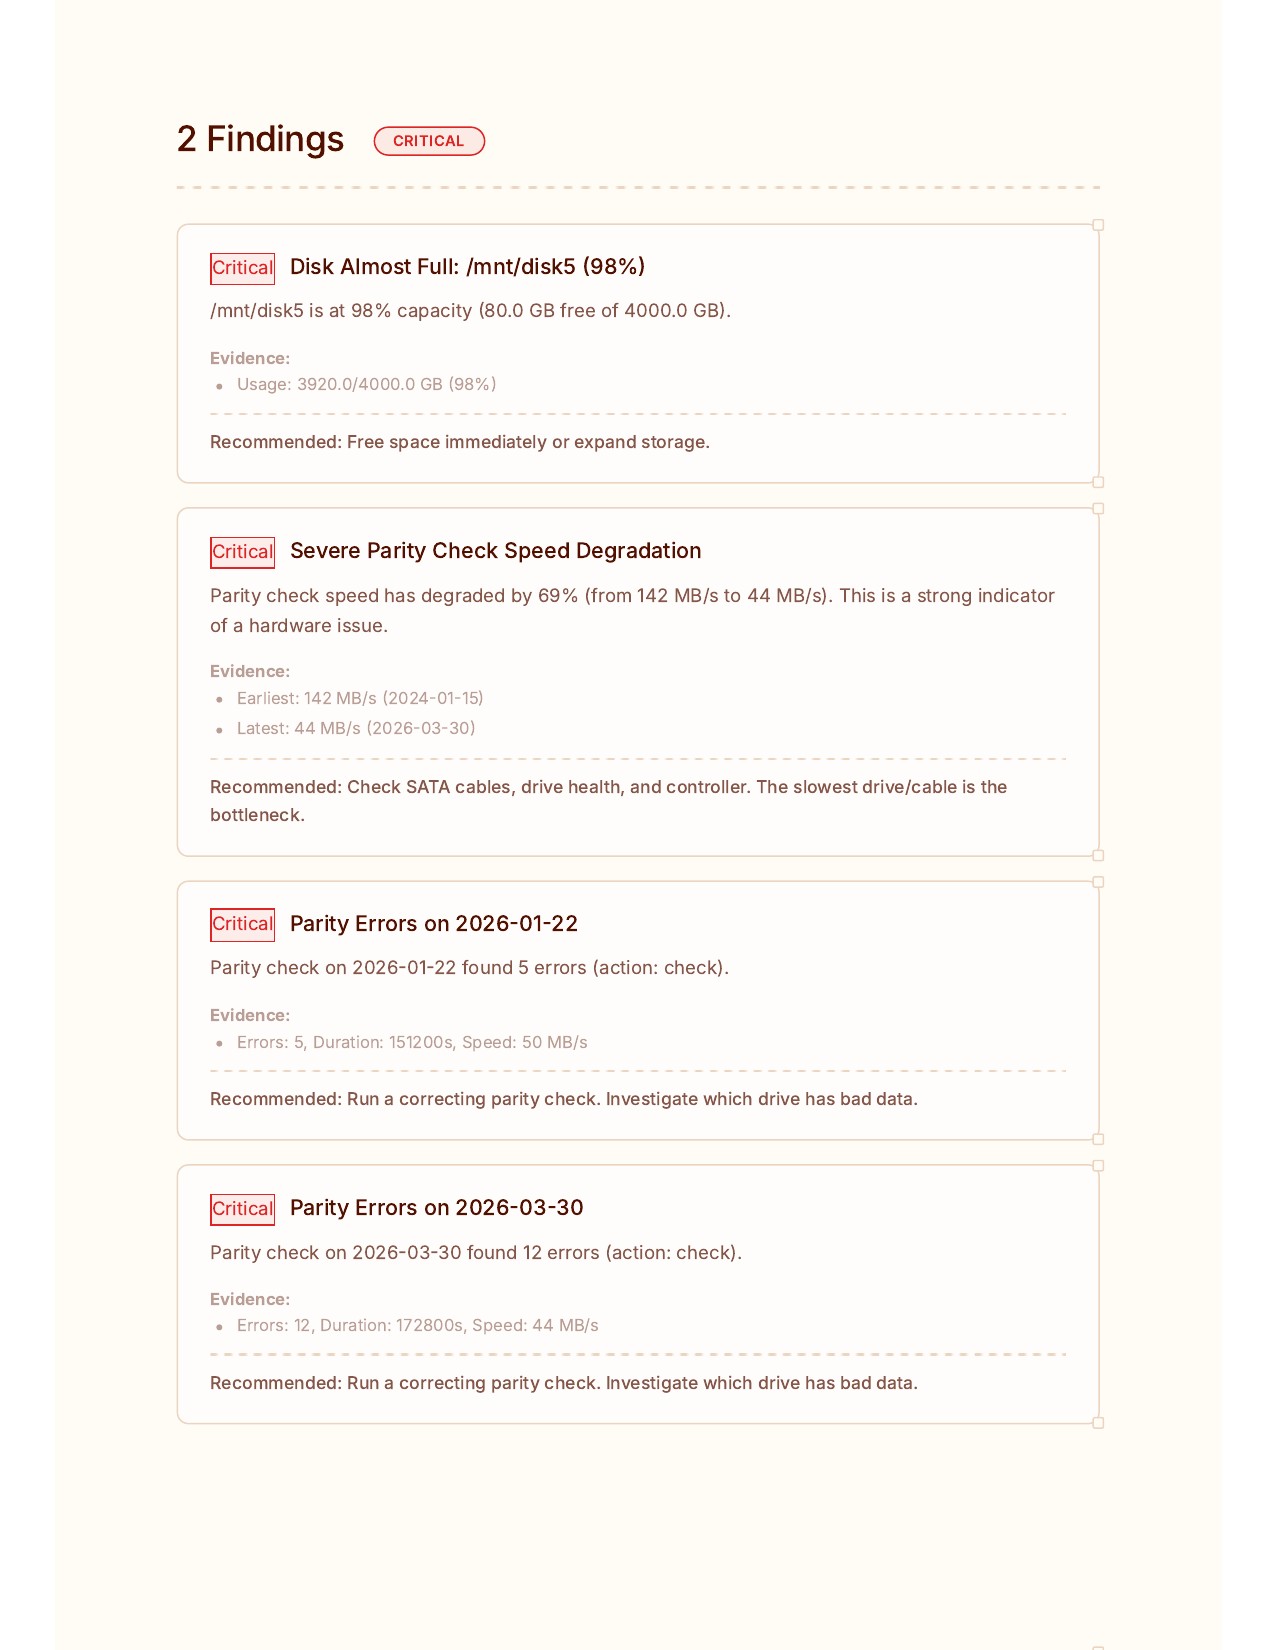
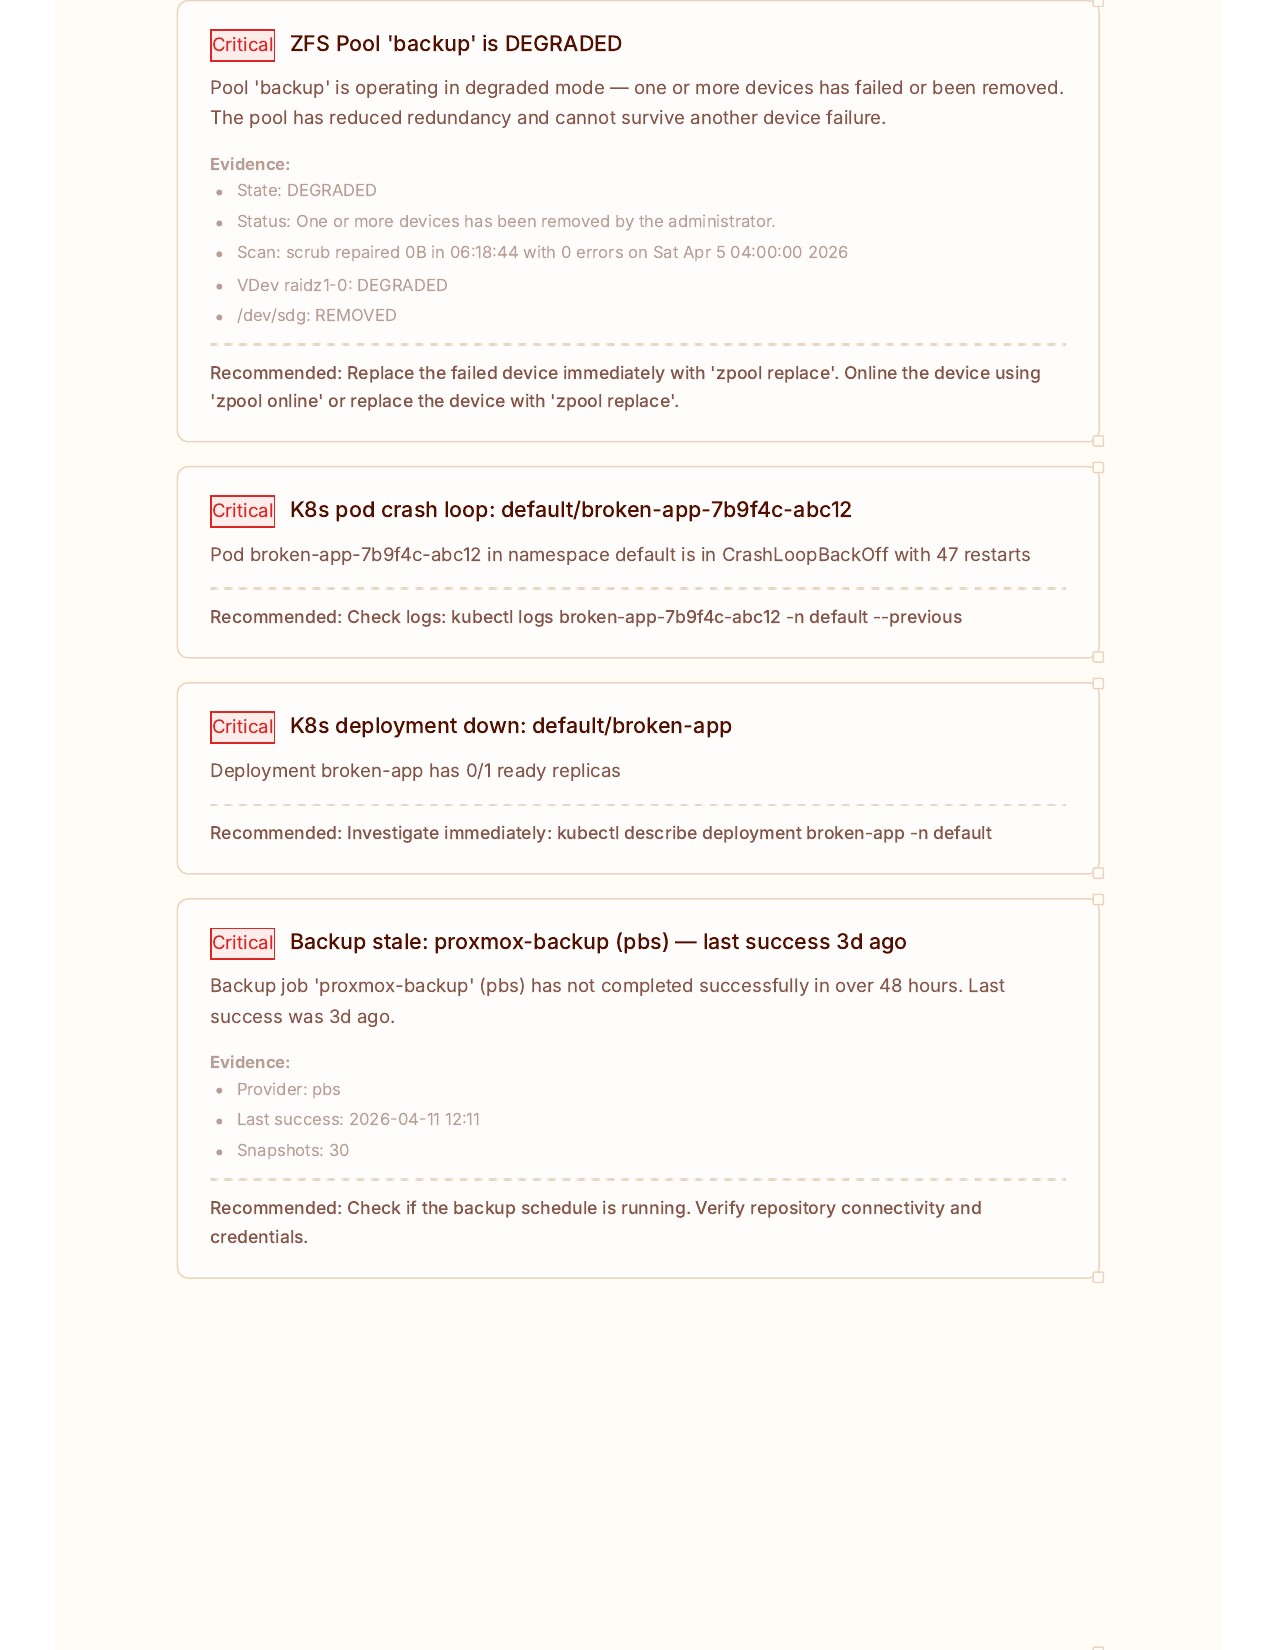
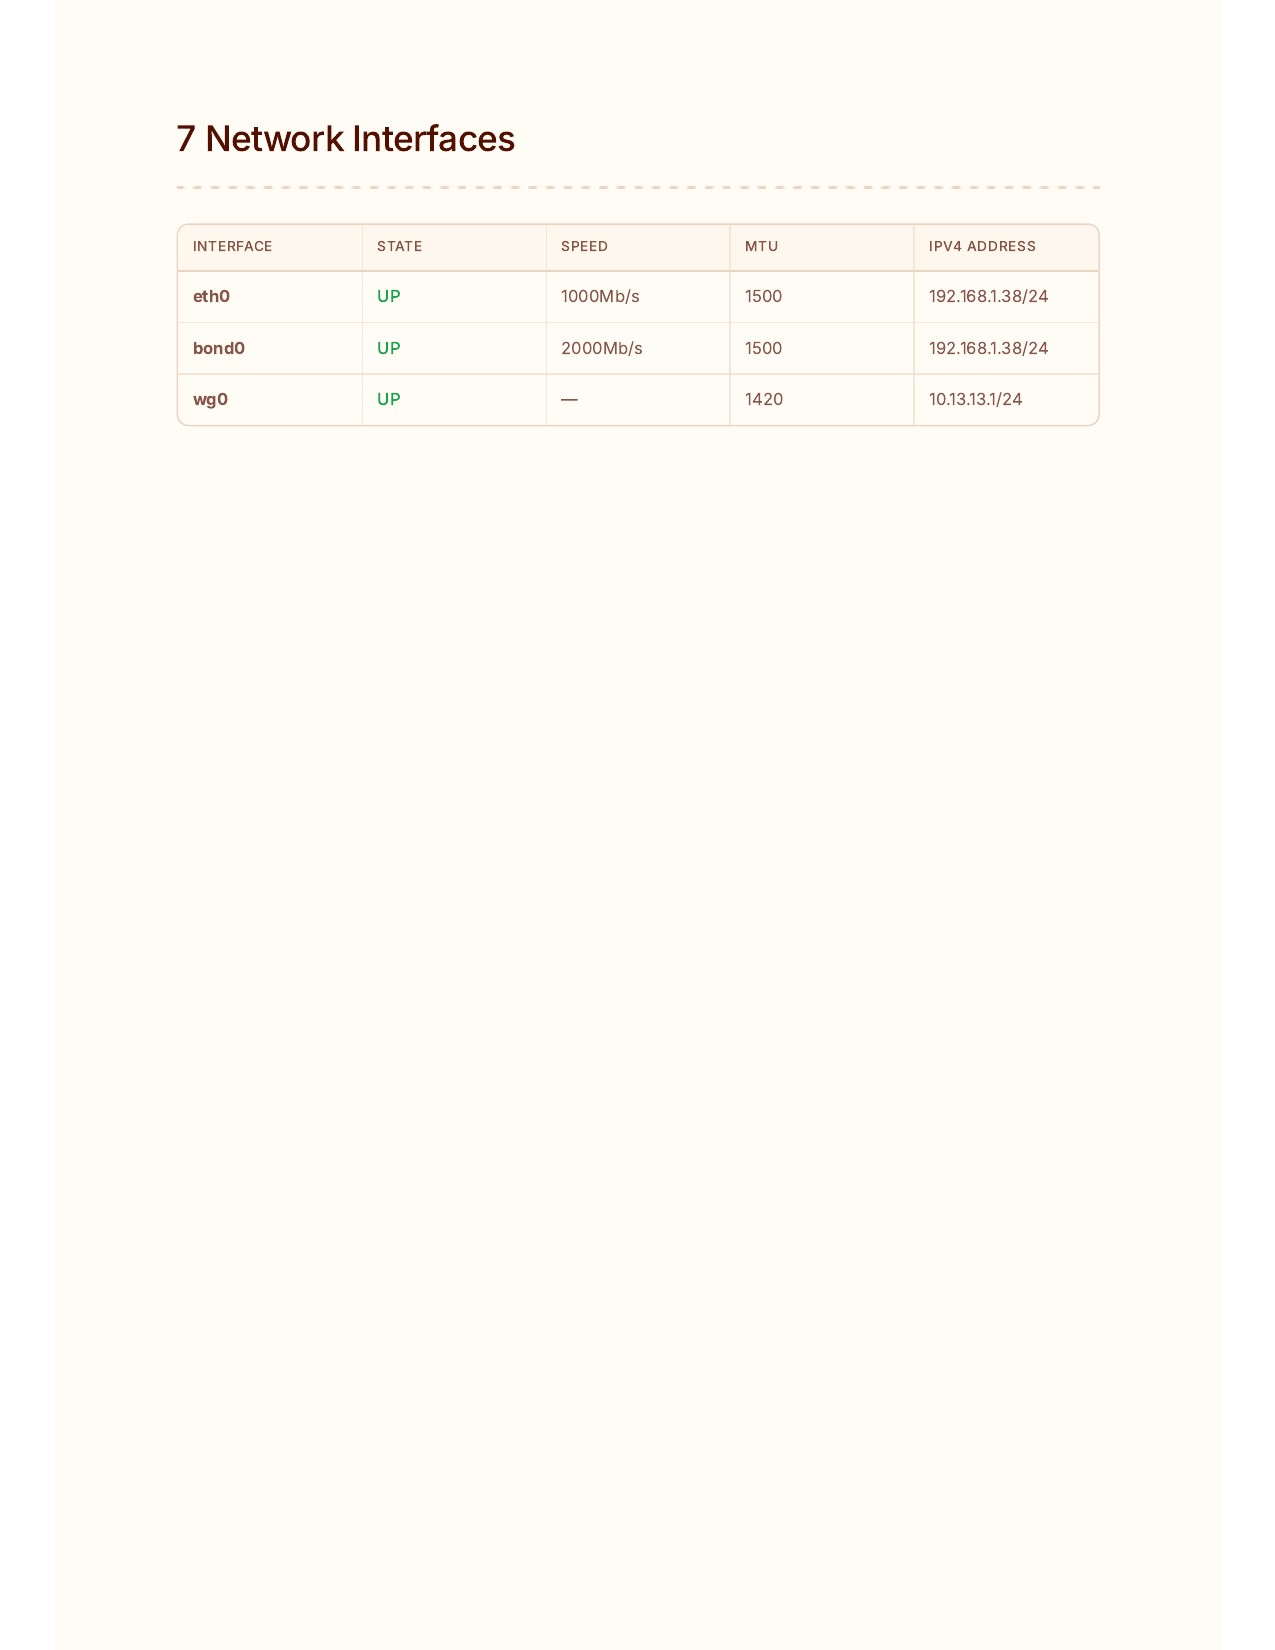
16 sections: System Overview, Findings, Drive Health & SMART, Docker, GPU, Backup, Speed Test, ZFS, UPS, Network, Service Checks, Proxmox, Kubernetes, Tunnels, Parity, Recommended Actions.
License
MIT
Categories
Related apps
Explore more like this
Explore allDetails
ghcr.io/mcdays94/nas-doctor:latestRuntime arguments
- Web UI
http://[IP]:[PORT:8060]- Network
host- Privileged
- true
- Extra Params
--pid=host
Template configuration
HTTP listen address (host networking). Change to e.g. :8067 to avoid port conflicts. If you type a bare number like 8067, it will be normalized to :8067 automatically. After changing, update the WebUI URL (container settings, Advanced View) to match.
- Target
- NAS_DOCTOR_LISTEN
- Default
- :8060
- Value
- :8060
Persistent data (SQLite database, config, backups)
- Target
- /data
- Default
- /mnt/user/appdata/nas-doctor
- Value
- /mnt/user/appdata/nas-doctor
Docker socket for container monitoring
- Target
- /var/run/docker.sock
- Default
- /var/run/docker.sock
- Value
- /var/run/docker.sock
Unraid emhttp status (required for merged drive view)
- Target
- /var/local/emhttp
- Default
- /var/local/emhttp
- Value
- /var/local/emhttp
Device nodes (required for SMART and GPU access)
- Target
- /dev
- Default
- /dev
- Value
- /dev
Sysfs (required for SMART, GPU, and drive mapping)
- Target
- /sys
- Default
- /sys
- Value
- /sys
Unraid boot config (parity logs, ident)
- Target
- /host/boot
- Default
- /boot
- Value
- /boot
System log files (syslog, messages)
- Target
- /host/log
- Default
- /var/log
- Value
- /var/log
Unraid version file (for OS update detection)
- Target
- /etc/unraid-version
- Default
- /etc/unraid-version
- Value
- /etc/unraid-version
Host disk mounts (for per-disk space monitoring)
- Target
- /host/mnt
- Default
- /mnt
- Value
- /mnt
Required ONLY for Tailscale peer detection (tailscale-nas-util plugin OR network_mode: host Tailscale Docker container). Leave unset if you don't use Tailscale.
- Target
- /var/run/tailscale
- Default
- /var/run/tailscale
- Value
- /var/run/tailscale
How often to run diagnostic scans (e.g. 30m, 1h, 6h, 24h)
- Target
- NAS_DOCTOR_INTERVAL
- Default
- 30m
- Value
- 30m
Container timezone (e.g. Europe/London, America/New_York)
- Target
- TZ
- Default
- UTC
- Value
- UTC
Optional bind-mount for External Borg Monitoring. Mount your host Borg repo path here as Read Only — NAS Doctor uses `borg --bypass-lock` so it never writes to the repo, making RO mounts safe. After adding the mount, configure the repo in Settings → Advanced → Backup Monitors → Borg. Leave blank if you don't use Borg or don't want to monitor external repos. No host binary mount needed — borg is bundled in the image.
- Target
- /mnt/user/appdata/borg
Optional passphrase for an encrypted Borg repo configured in Settings → Advanced → Backup Monitors → Borg. NAS Doctor reads this env var by name (configurable per-repo if you have multiple passphrases). Leave blank if your repos are unencrypted or if you don't use external Borg monitoring.
- Target
- BORG_PASSPHRASE