

Log-to-LLM-Sentinel
Docker app from Asch3's Repository
🇬🇧 English Log-to-LLM Sentinel is an AI-powered log monitoring and analysis tool.
Overview
Readme
View on GitHub🛡️ Log to LLM Sentinel
Your intelligent log guardian powered by Local AI.
Log to LLM Sentinel is a modern, lightweight, and powerful log monitoring tool. Unlike traditional tools that just search for text, Sentinel uses Ollama (Local LLM) to understand why an error happened and tells you exactly what you need to know.
[!WARNING] Disclaimer: This application was originally designed to meet the creator's personal self-hosting needs. Security has not been independently audited, as the intended use case is strictly local/private network. Use this software at your own risk. Contributions to improve security, testing, and robustness are highly welcome!
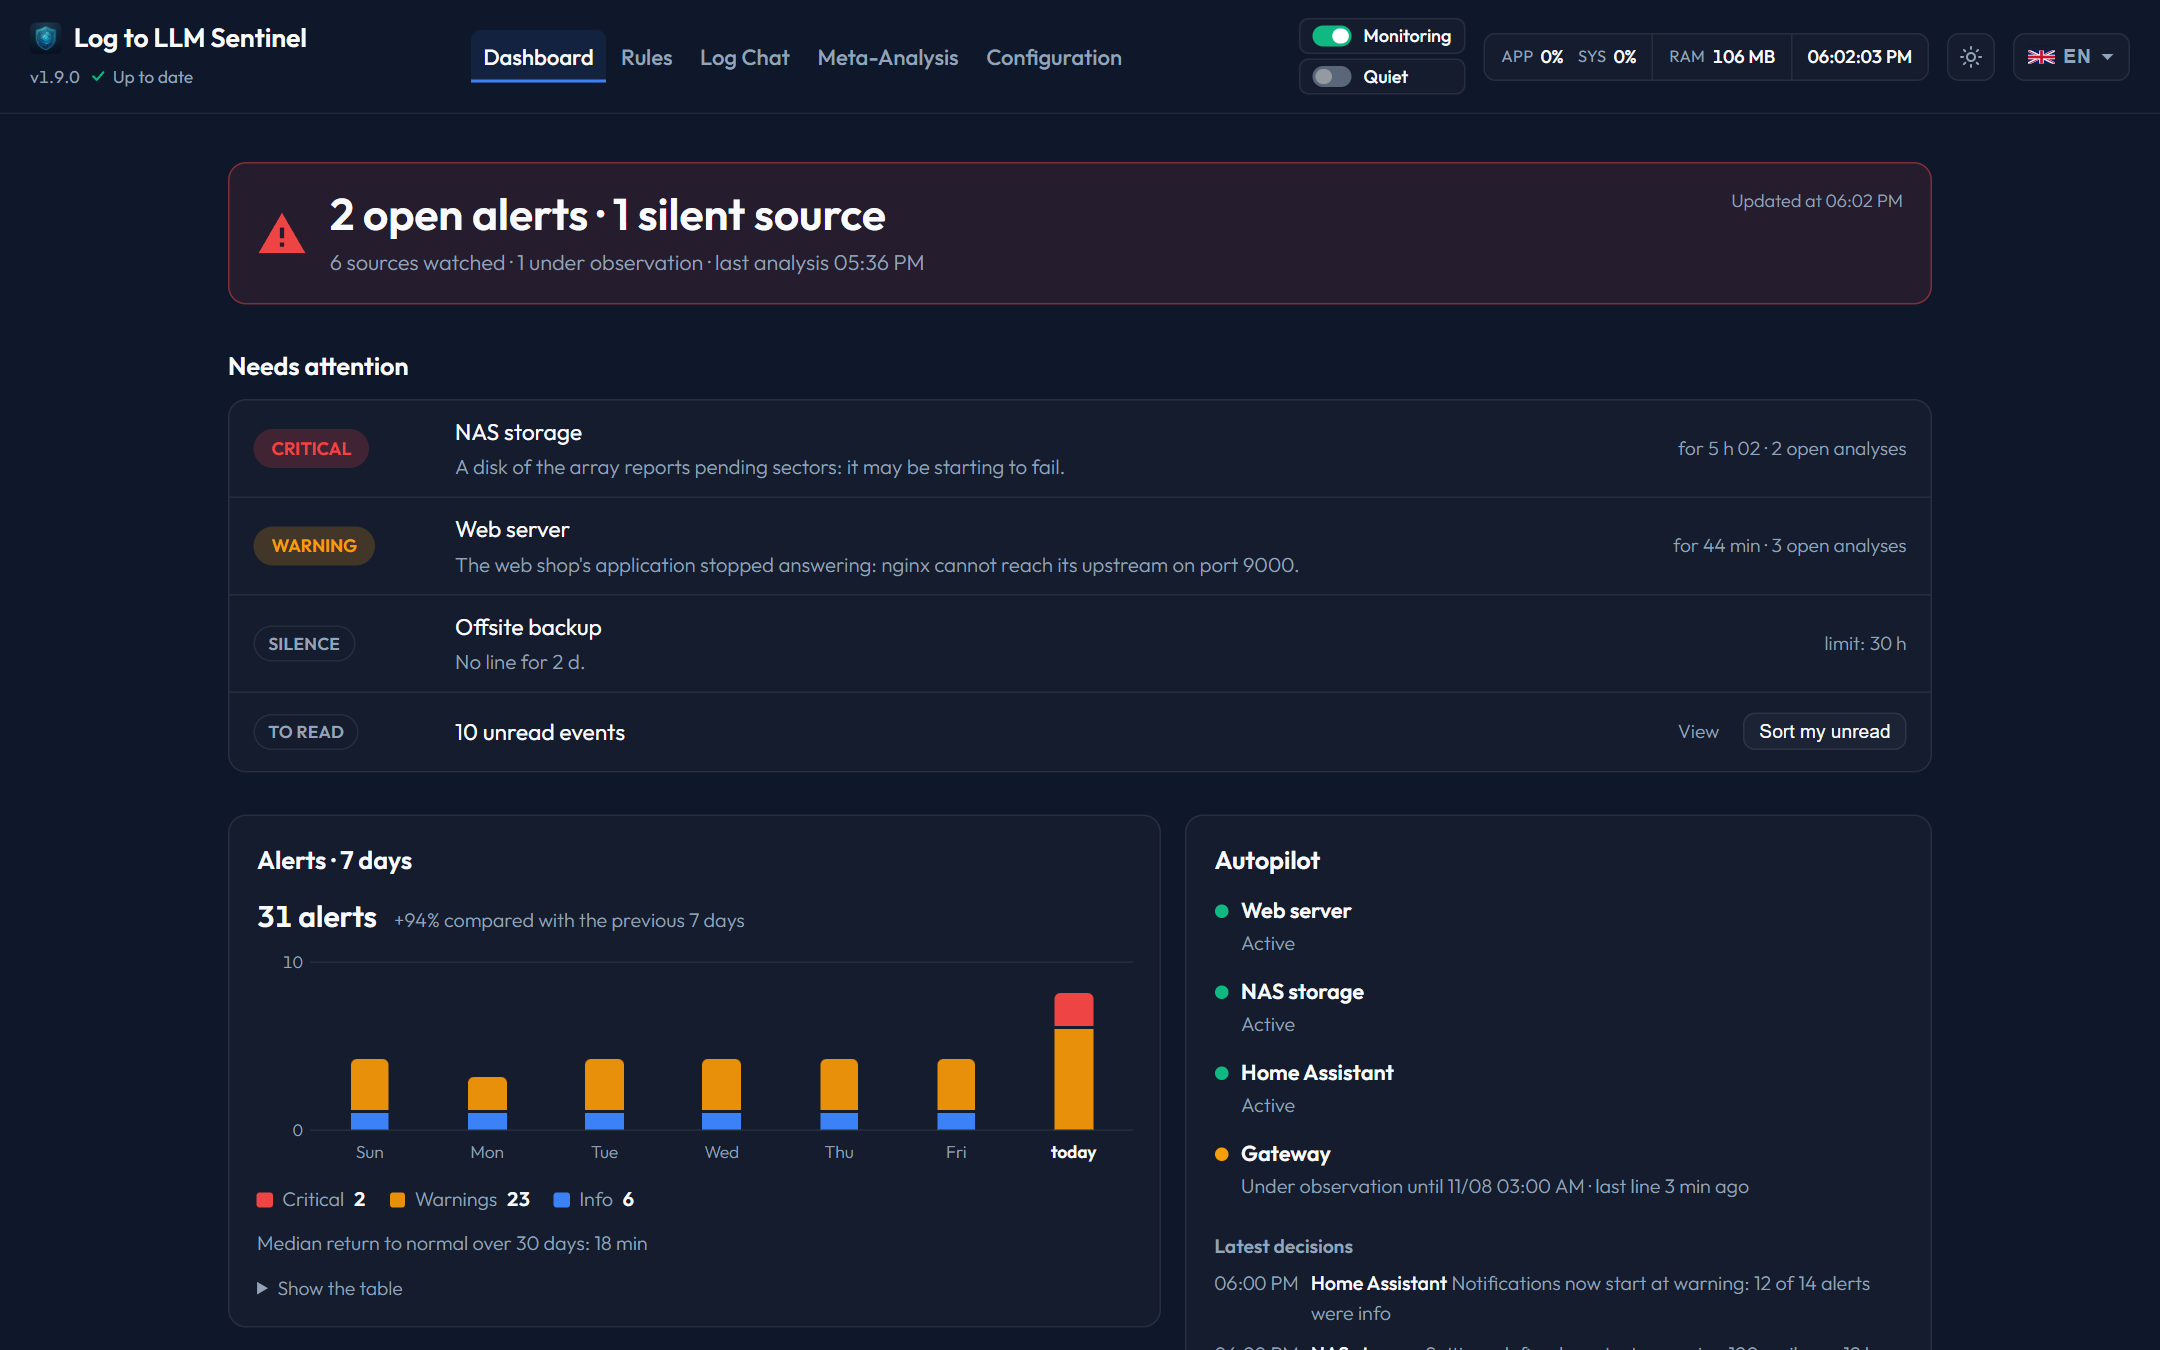
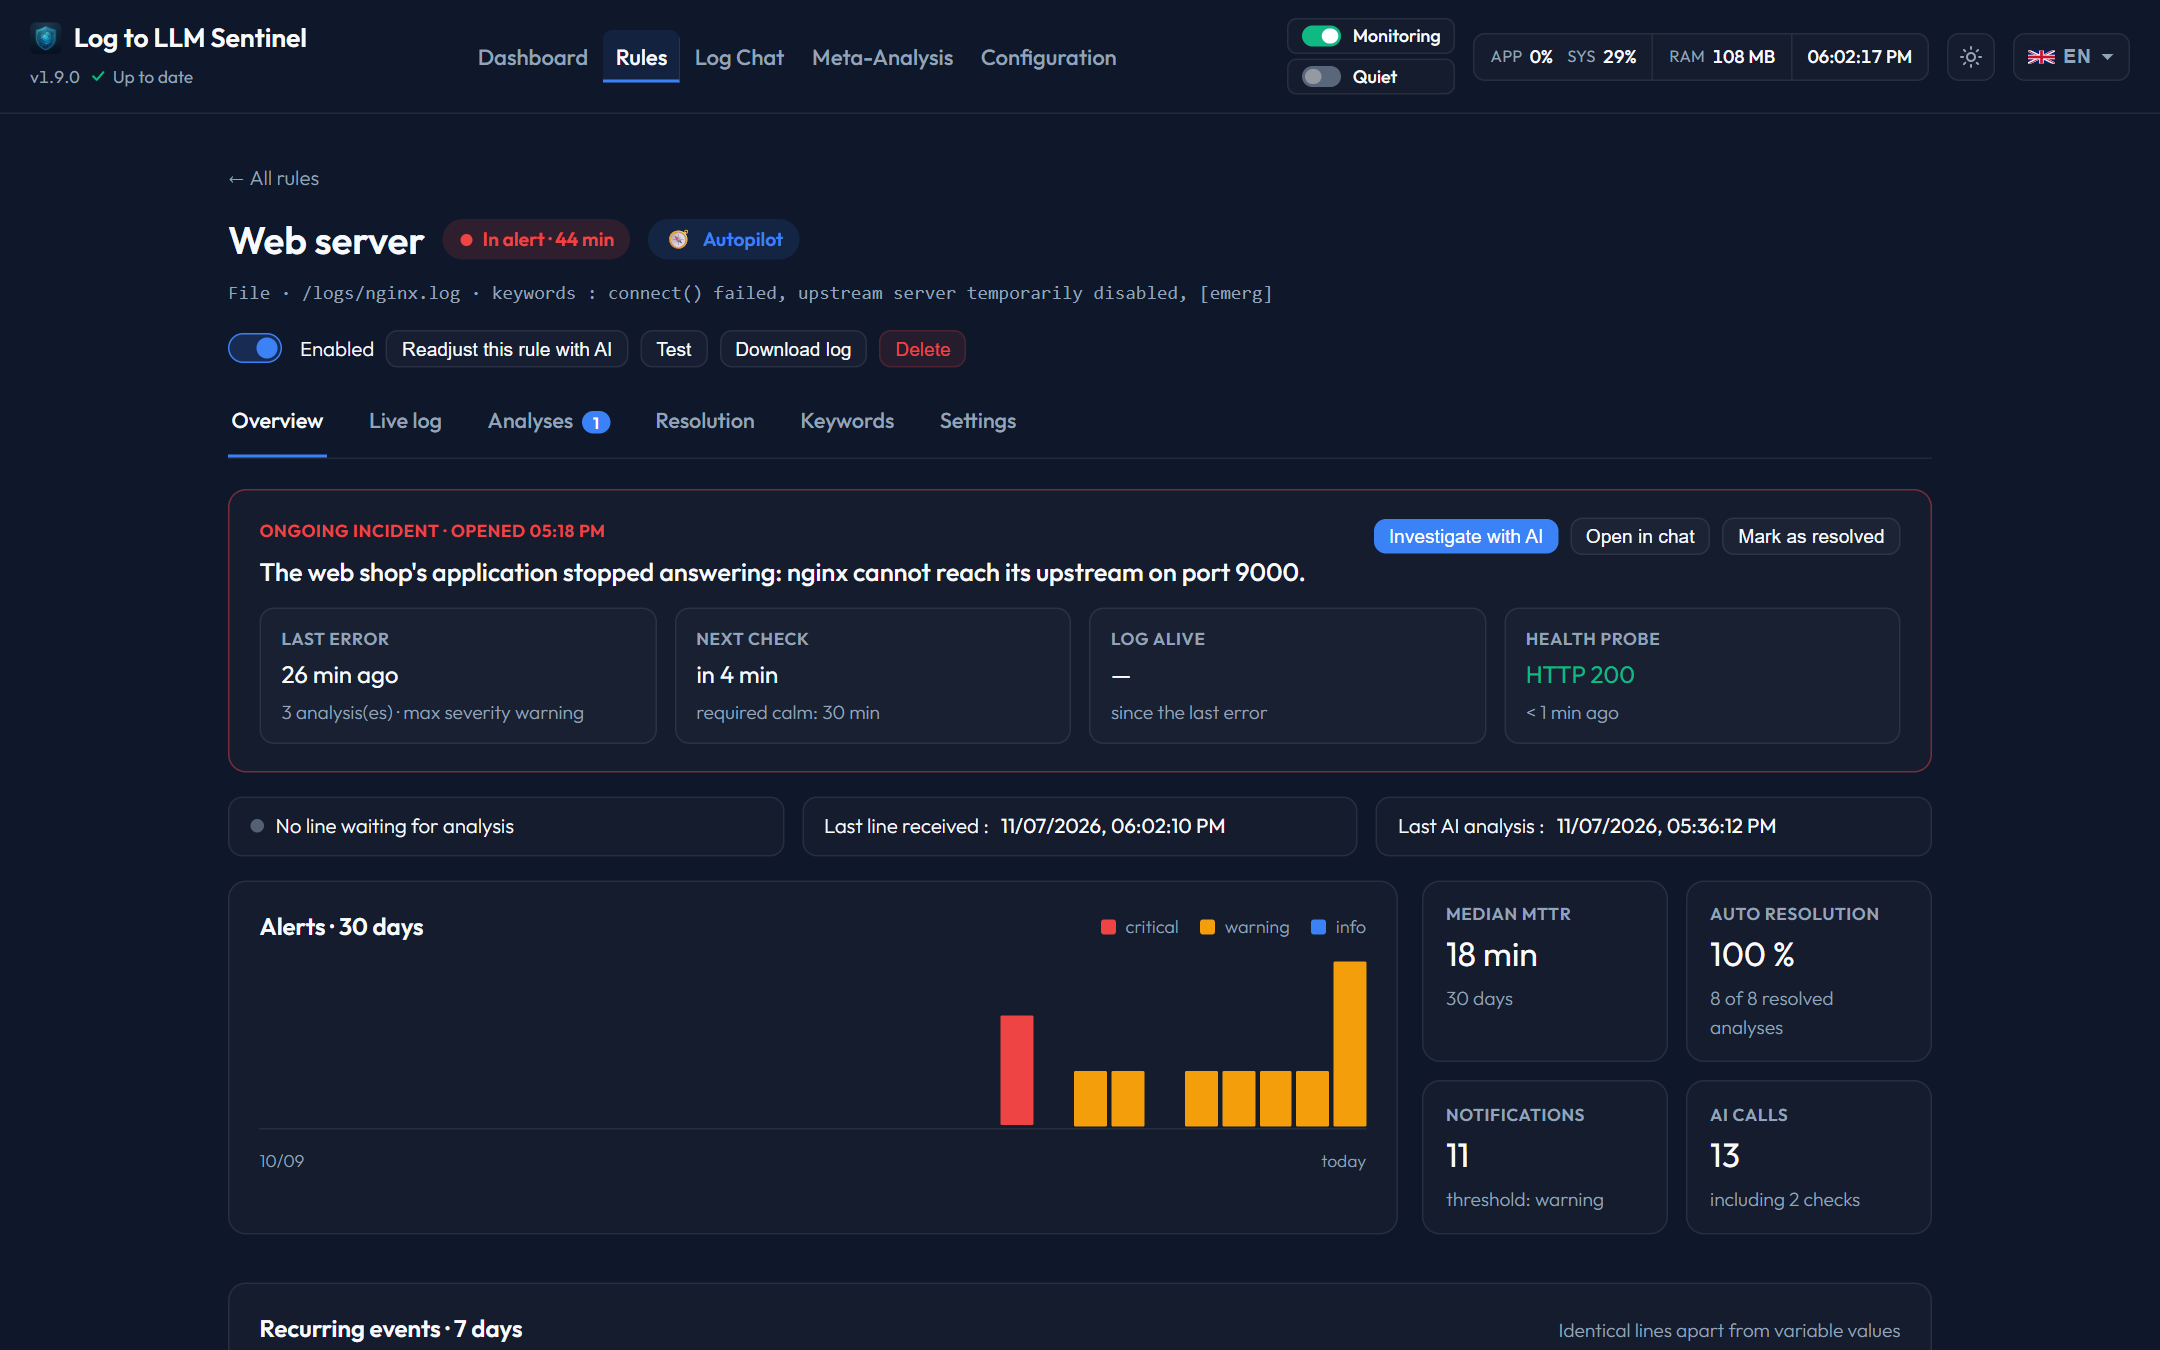
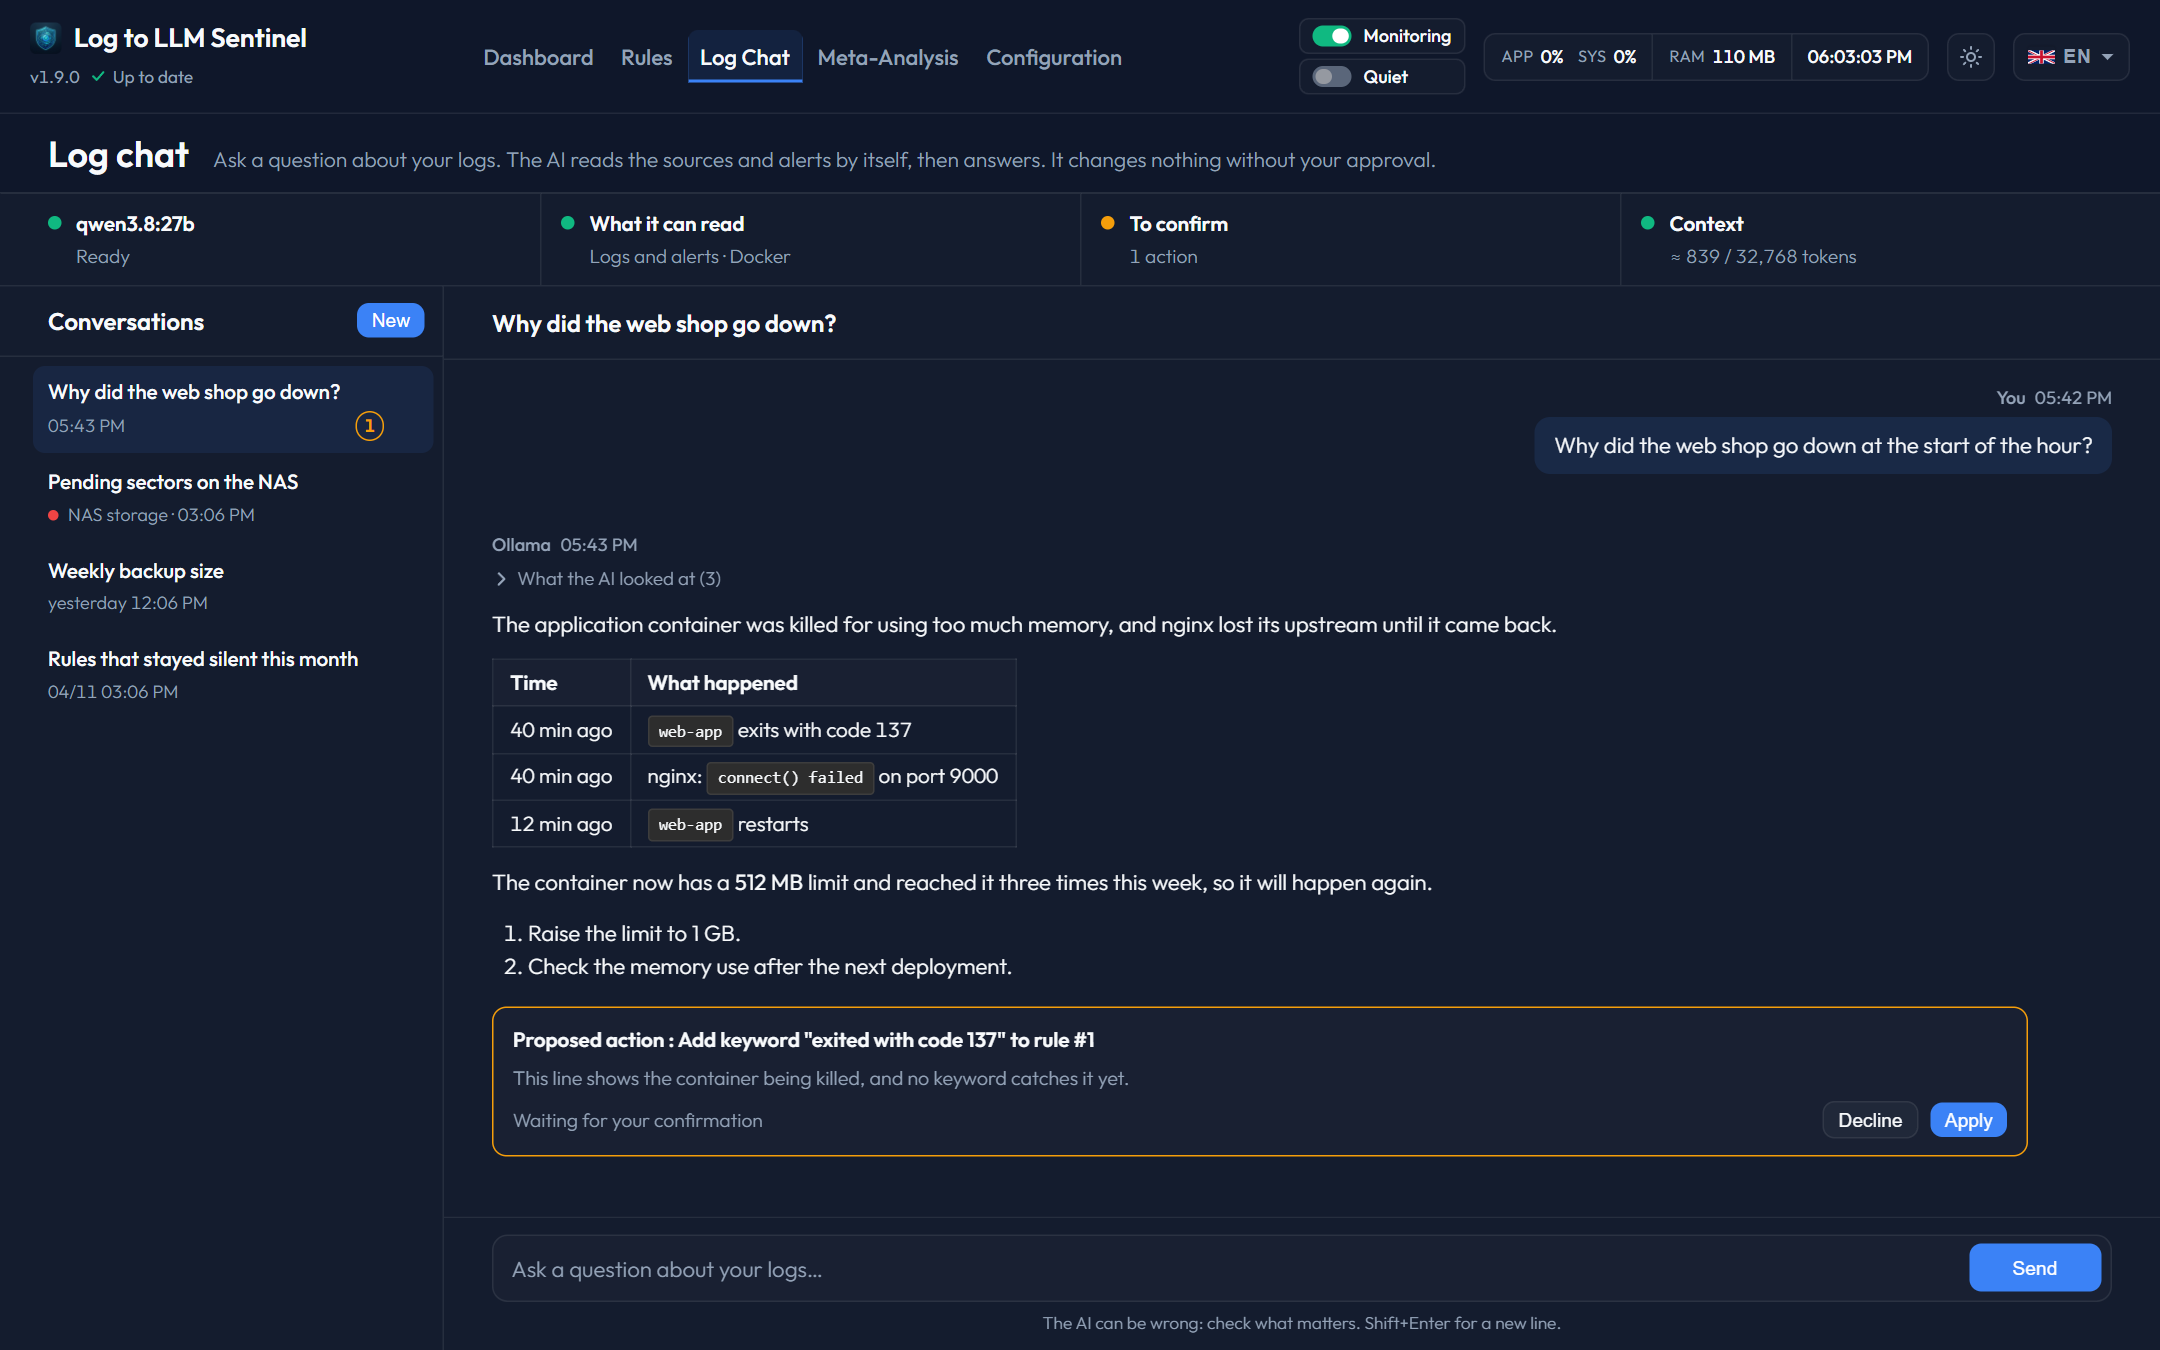
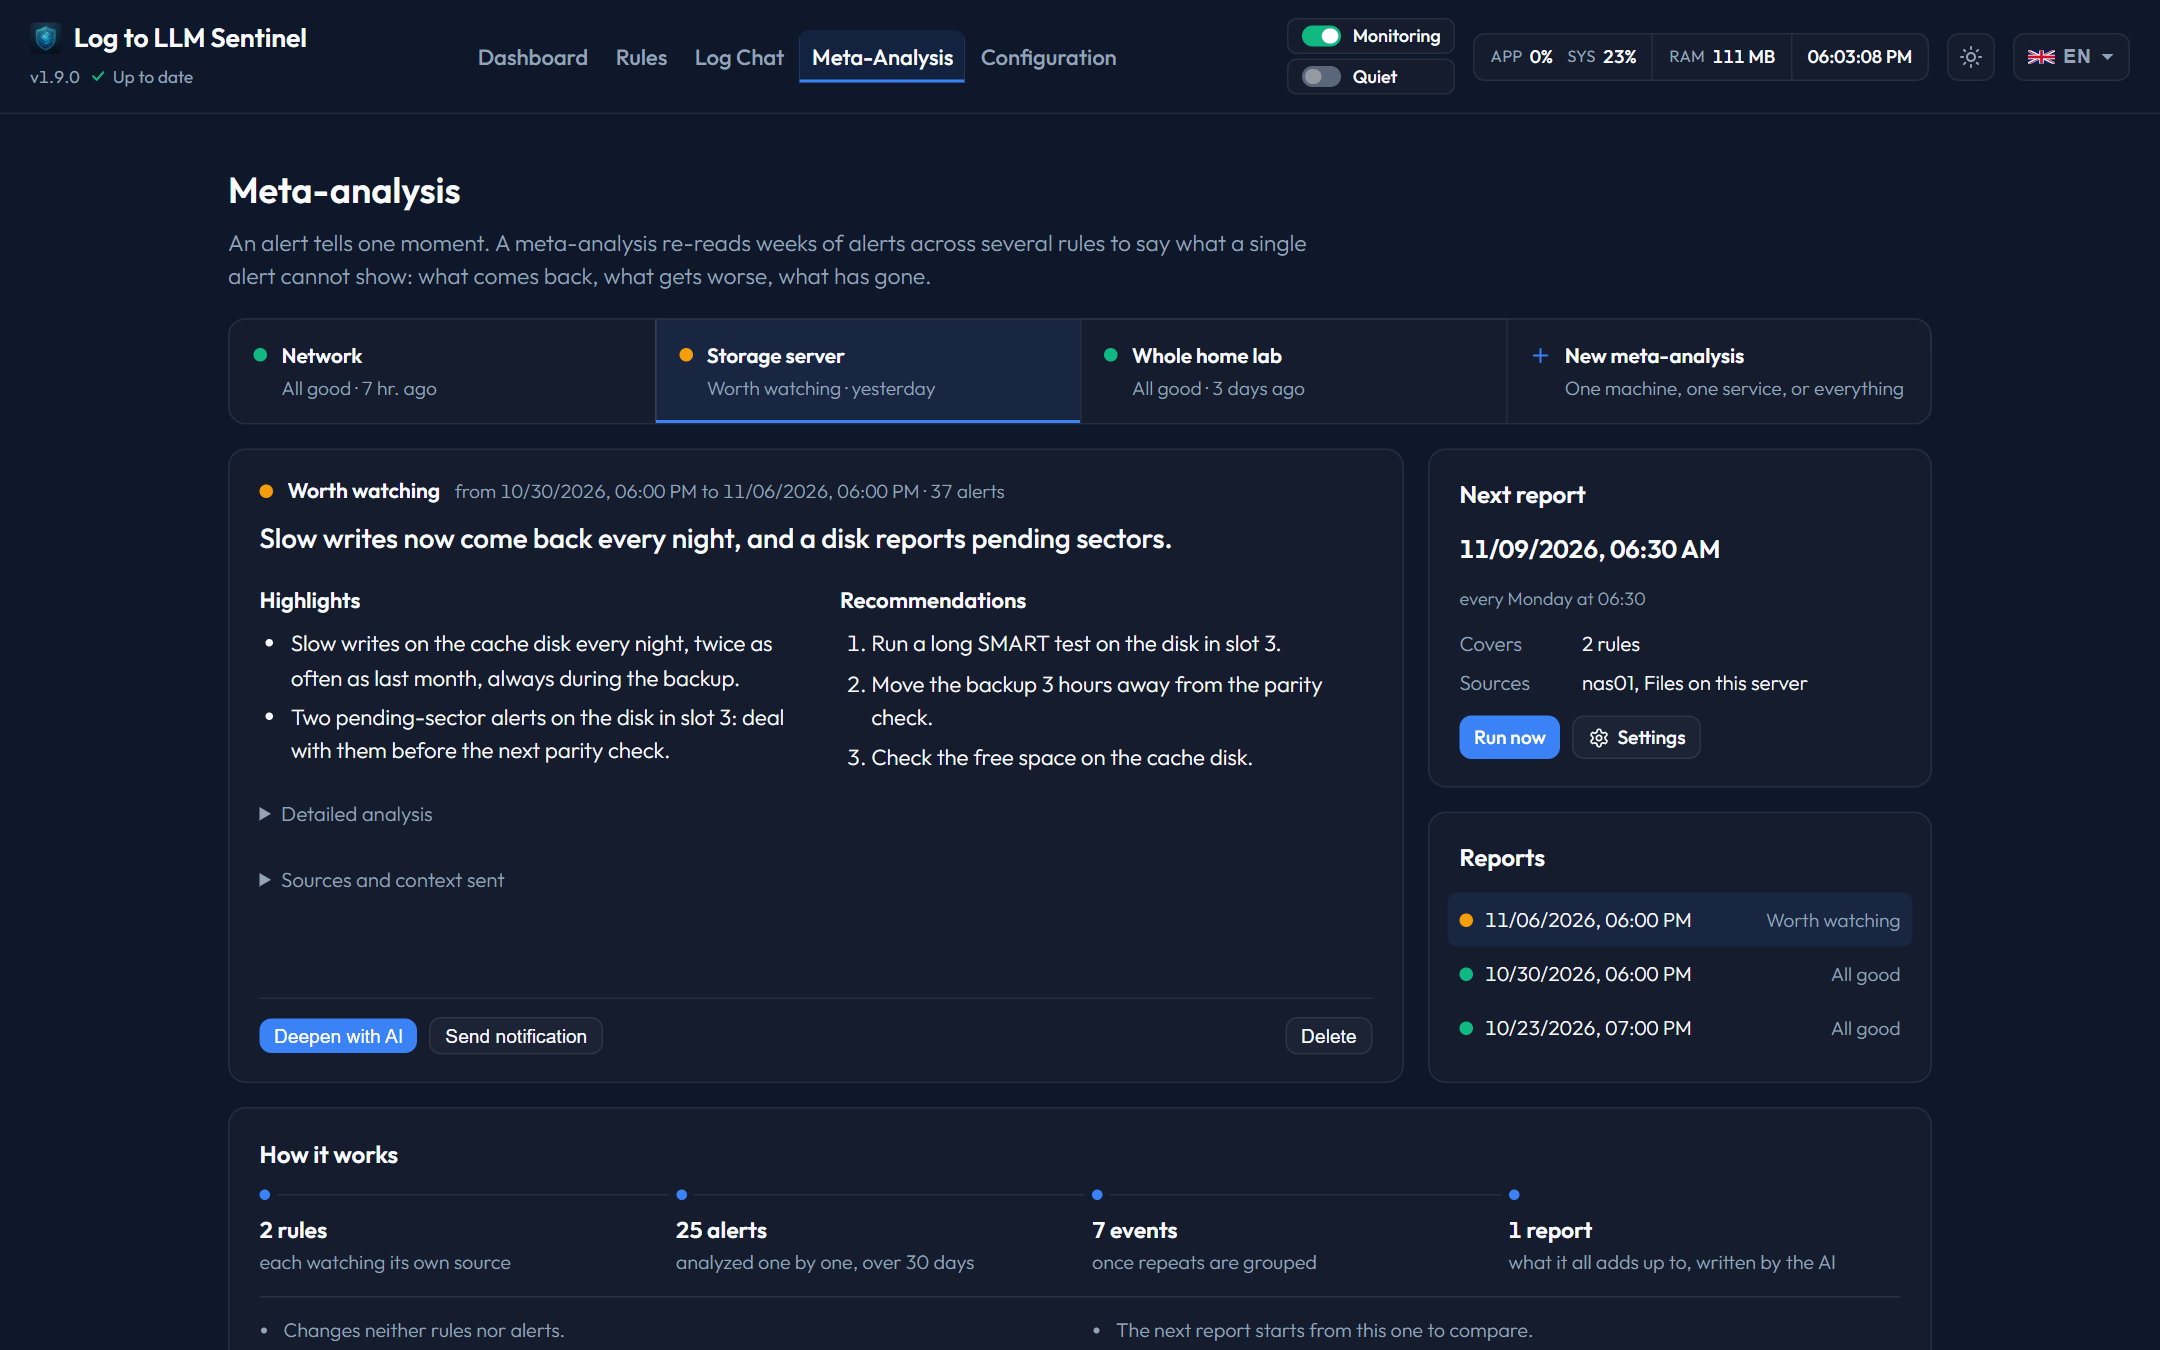
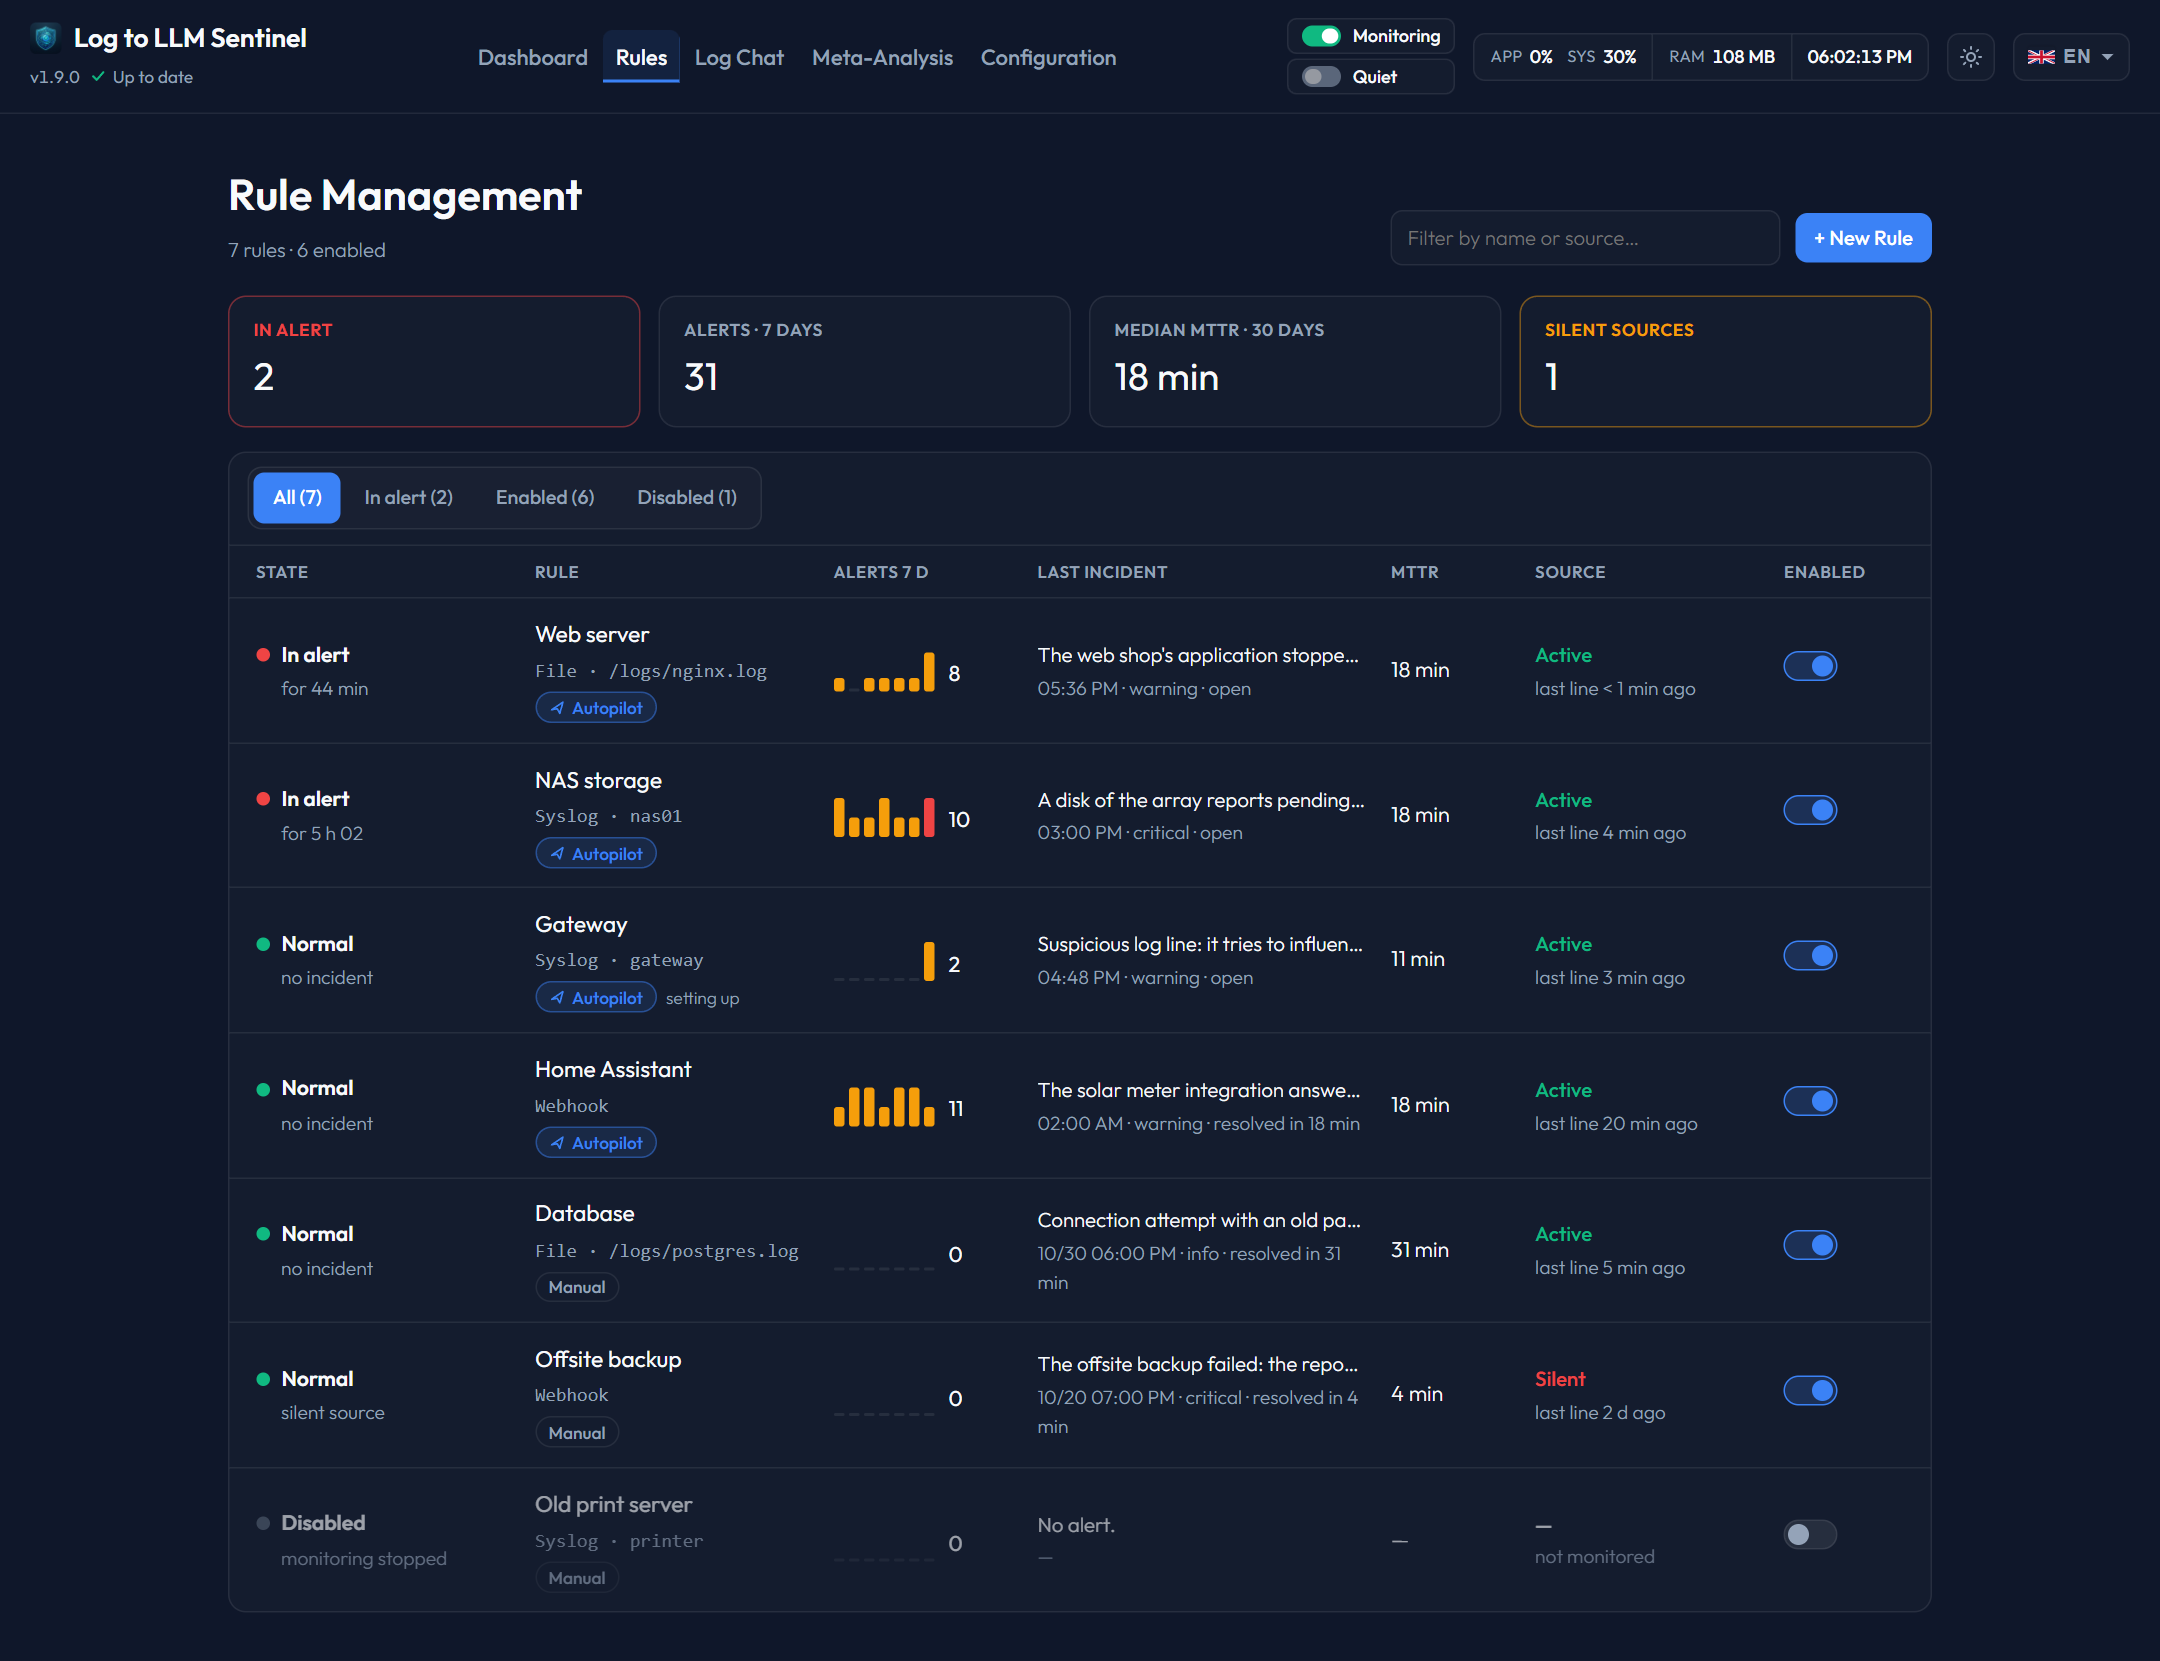
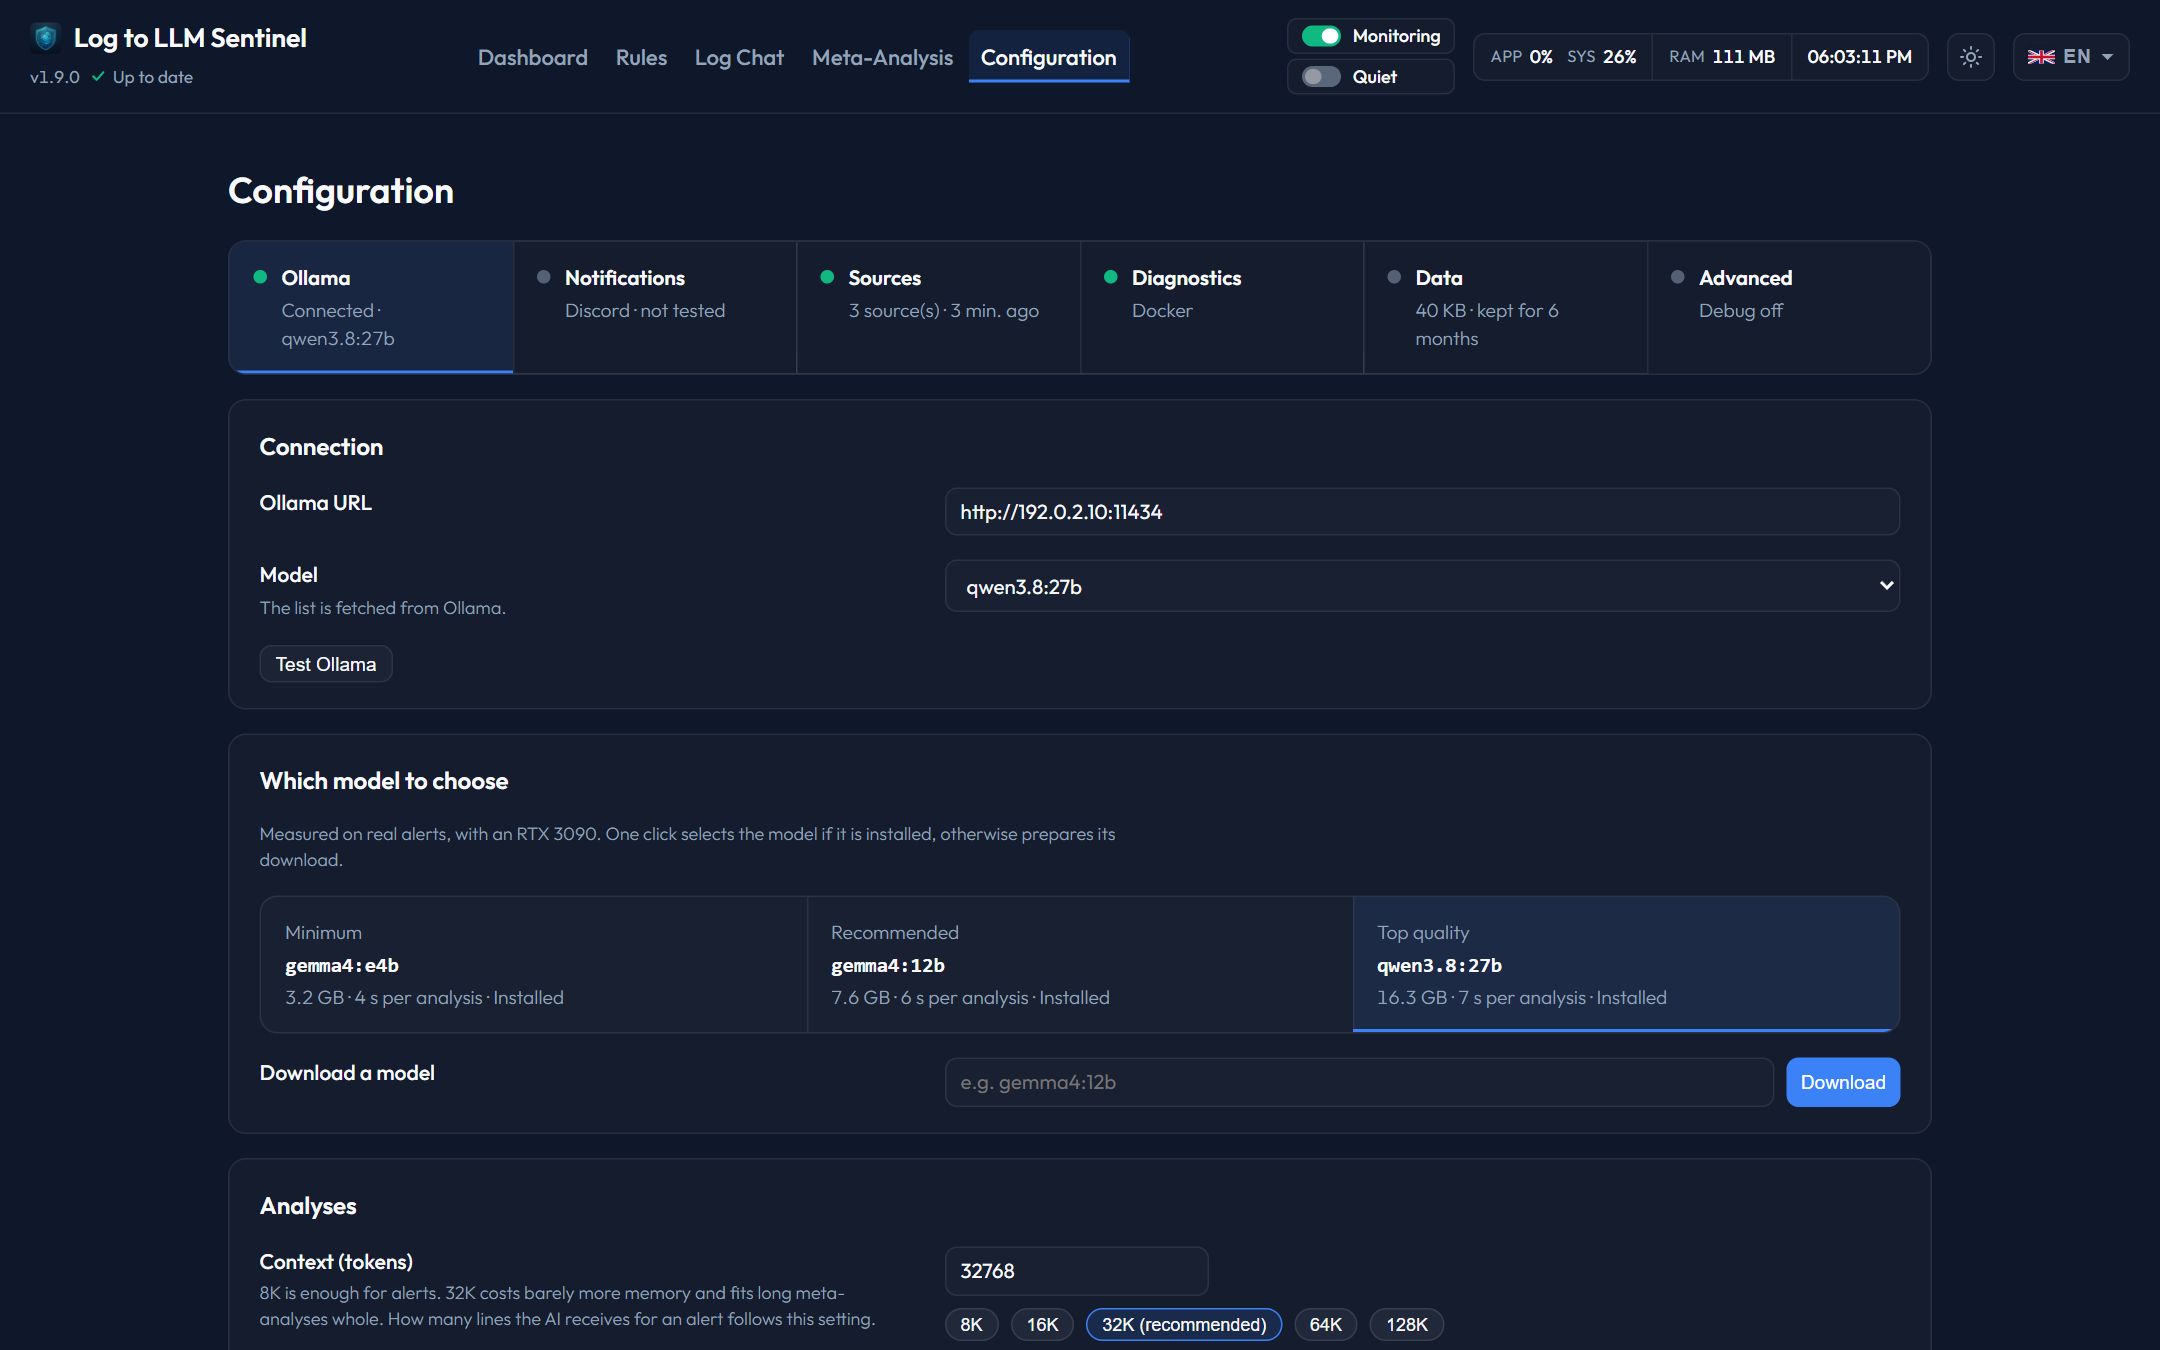
✨ Key Features
🧠 Smart AI Analysis: Don't just get alerted; get an explanation. Sentinel uses Ollama to analyze log context and provide a human-readable diagnosis.
💬 Interactive AI Chat: Deepen any diagnosis by starting a conversation with the AI. The dedicated chat interface allows you to ask follow-up questions and brainstorm solutions in real-time.
🩺 Read-only Infrastructure Diagnostics: Instead of telling you to run
docker psordf -h, the chat AI can check container state, health, restarts and logs, and server disks, memory, network shares and services itself — through a read-only Docker socket proxy and an SSH key restricted to a fixed list of checks. See Diagnostics.📊 AI Meta-Analysis: Get the big picture. Schedule daily, weekly, or monthly reports that aggregate multiple detections into a high-level summary of your system's health and trends.
🧭 Autopilot: Just give the log source. The local AI reads the history (or watches the source for 24 h), names the rule, describes what is normal in this log, picks the keywords, and sizes the grouping window and the silence alert from the real rhythm of the lines.
🤖 Self-tuning keywords: Not sure what to look for? Leave the keywords empty: the local AI reads the log history, adds keywords for the errors nothing catches, and removes the noise — every change checked against your data and undoable.
📨 Syslog Server & Relay: Turn Sentinel into a remote syslog UDP server (listening on port 10514 UDP on host). Ingest remote logs (e.g., from Unraid) and optionally forward them to a secondary syslog server as a relay.
📥 Sort my unread: Back after a few days? The AI goes through your unread events and suggests which ones can be marked as read, with a reason for each. You validate, and you can undo.
🔎 CVE sheets and web search (optional): an alert citing a CVE shows whether it is actively exploited and which versions are affected, and the chat can search the web through your own SearXNG, with queries filtered so nothing private leaves.
🛡️ Log line safety: Log lines can hold text chosen by an attacker. Sentinel treats them as data, and a line that tries to talk the AI out of an alert is flagged instead of obeyed.
🔗 Home Assistant Ready: Use Webhooks to stream logs from your smart home directly to Sentinel.
🔔 Smart Notifications: Integrated with SMTP and Apprise (Discord, Telegram, Slack). Sentinel intelligently adapts to character limits by asking the local AI to generate concise summaries when needed, ensuring critical alerts always fit your favorite messaging platform.
🌍 Fully Multilingual: Beautiful interface available in English and French.
🔒 100% Private: Everything runs locally on your machine. No data ever leaves your network.
🚀 Quick Start (For Non-Experts)
The easiest way to run Sentinel is using Docker. This ensures all components (Database, Web Server, and AI) work together perfectly.
Unraid (Community Applications)
If you are using Unraid, Log-to-LLM Sentinel is available directly from the Community Applications (CA) store!
- Go to the Apps tab in your Unraid dashboard.
- Search for
Log-to-LLM Sentinel. - Click Install and configure your paths.
- Note for Custom Logs: By default, the template maps Unraid's Docker logs (
/var/lib/docker/containers) and system logs (/var/log). If you want to monitor other specific logs (e.g., from a specific appdata folder), add a new Path mapping in the template settings, and then append the container path to theSENTINEL_BROWSE_ROOTSvariable (e.g.,/logs,/app/data,/docker-logs,/system-logs,/custom-app-logs).
- Note for Custom Logs: By default, the template maps Unraid's Docker logs (
Docker & Docker Compose
1. Prerequisites
- Install Docker Desktop (Windows/Mac) or Docker Compose (Linux).
- (Optional) Install Ollama locally to use your GPU.
2. Get the files
Either Clone this repository or Download the project as a ZIP and extract it on your computer.
git clone https://github.com/Aschefr/log-to-llm-sentinel
cd log-to-llm-sentinel
3. Generate your Configuration
Download the file by right clicking docker-setup.html and select "Save link as")
We provide a visual tool to help you create your docker-compose.yml file:
- Open it with your favorite web browser (Chrome, Firefox, Edge...).
- Select your options (Port, Log folders, AI mode).
- Copy the generated YAML code.
- Open the existing
docker-compose.ymlfile in your project folder, delete its content, and paste your custom code.
4. Launch the Sentinel
Open a terminal in your project folder and run:
docker-compose up -d
Docker Desktop on Windows: keep the database in a Docker volume. A folder of your Windows disk, like
./data, is shared with the container through a slow network layer, and every page then waits for the database: about 1.3 s per request on our test PC, against 50 ms on Linux. Add this to yourdocker-compose.ymlto keepsentinel.dbinside Docker while the rest of./datastays on your disk:services: sentinel: volumes: - sentinel-db:/app/db environment: - DATABASE_URL=sqlite:////app/db/sentinel.db volumes: sentinel-db:On an existing install, stop Sentinel and copy
data/sentinel.dbinto the volume first, or Sentinel starts with an empty database.
5. Access the Interface
Once the containers are started, open your browser and go to the port you chose (default is 10911): 👉 http://localhost:10911
🤖 AI Configuration Note
- Internal Ollama: If you chose the "Internal" mode in the configurator, Sentinel is already pre-configured to talk to its own AI engine.
- External Ollama: If you use an existing Ollama install, you will need to enter its address (e.g.,
http://192.168.x.x:11434) in the Configuration page of the Sentinel UI. - Important: This project is designed for Local AI only. It currently does not support external cloud APIs like ChatGPT, Claude, or Gemini.
📖 How it Works
- Define a Rule: Point Sentinel to a log file or a Webhook token.
- Set Keywords: Choose which words should trigger an alert (e.g.,
error,failed,critical). - AI Kick-in: When a match is found, Sentinel grabs the surrounding lines and sends them to your local AI.
- Get Notified: You receive a notification with a summary of the situation and the AI's diagnosis.
💡 Self-tuning keywords
Setting up keywords can be tedious, so Sentinel keeps them up to date by itself:
- A new rule analyzes the last 7 days of its log: the AI proposes the keywords that matter.
- Every hour, error lines that no keyword catches ("blind spots") and keywords that only produce noise are reviewed by the local AI.
- Flag an alert Not relevant and the AI adds the right exclusion.
- Add a note to tell the AI what the logs cannot, such as "this server has no systemd": the next alerts on that event or source take it into account.
- Every change is checked against your data first (it must appear in the real lines, must not hide important alerts…), logged in the rule's Keywords tab and can be undone in one click. Prefer to approve each change? Switch the rule to Suggestions.
📊 Meta-Analysis: The Big Picture
For long-term monitoring, use Meta-Analysis:
- Define a schedule (Daily, Weekly, Monthly).
- Select which rules to include.
- Sentinel will collect all relevant analyses and generate a global synthesis.
- Perfect for identifying silent trends that don't trigger individual critical alerts but are recurring.
🔌 Integrations
🏠 Home Assistant Integration
The simplest way is the Home Assistant source of a rule: enter the address and a long-lived access token, with nothing to install in Home Assistant. See Log sources, which also covers Docker logs, MQTT and log shippers.
If you prefer Home Assistant to push its logs, use a webhook:
1. Create a Webhook Rule in Sentinel
- Go to the Rules page in Sentinel.
- Click + New Rule.
- Keep Autopilot to let the AI set up the rule, or choose Manual.
- Under Source of logs, select Webhook API.
- Sentinel generates a unique URL for you. Copy this URL, then click Save.
2. Add the automation to Home Assistant
The best way to integrate this is by using Packages, which keeps your configuration clean and modular.
- Install File Editor: Go to Settings -> Add-ons and install the File Editor add-on (and start it).
- Create the
packagesfolder:- Open the File Editor UI.
- Click the Folder icon in the top left corner.
- If you don't see a
packagesfolder, click the New Folder icon (the folder with a plus sign) and name itpackages.
- Enable Packages in Home Assistant:
- In File Editor, open your
configuration.yamlfile (usually in/config/). - Add the following lines at the top level (ensure
homeassistant:is only defined once):homeassistant: packages: !include_dir_named packages
- In File Editor, open your
- Create the Sentinel Package:
- In File Editor, go into the
packagesfolder and create a new file namedlog-to-llm-sentinel.yaml. - Paste the following code into it (replace
LOG-TO-LLM-SENTINEL-IPwith the IP address of your Docker host (same as in yourdocker-compose.yml) andYOUR-TOKENwith the token from the URL copied from the Sentinel UI (format=xxxxxxxx-xxxx-xxxx-xxxx-xxxxxxxxxxxx)):
- In File Editor, go into the
rest_command:
  sentinel_log_webhook:
    url: "http://LOG-TO-LLM-SENTINEL-IP:10911/api/webhook/logs/YOUR-TOKEN"
    method: POST
    headers:
      Content-Type: "application/json"
    payload: >-
      {{ {"lines": [level ~ " [" ~ name ~ "] " ~ (message | string | truncate(800, True, "...")) ~ (" | EXCEPTION: " ~ (exception | string)[-800:] if exception else "")]} | tojson }}
    timeout: 10

system_log:
  fire_event: true

automation:
  - id: sentinel_forward_ha_logs_realtime
    alias: "Sentinel - Forward HA logs (realtime)"
    description: >
      Envoie chaque entree du journal HA vers Log Sentinel
      en temps reel via system_log_event.
    mode: queued
    max: 100
    trigger:
      - platform: event
        event_type: system_log_event

    condition:
      - condition: template
        value_template: >-
          {{ trigger.event.data.name not in
             ['homeassistant.components.rest_command',
              'homeassistant.util.logging',
              'homeassistant.components.automation.sentinel_forward_ha_logs_realtime',
              'homeassistant.helpers.template'] }}

    action:
      - service: rest_command.sentinel_log_webhook
        data:
          level: "{{ trigger.event.data.level }}"
          name: "{{ trigger.event.data.name }}"
          message: "{{ trigger.event.data.message[0] if trigger.event.data.message is list else trigger.event.data.message | string | truncate(800, True, '...') }}"
          exception: "{{ trigger.event.data.exception | default('') | string }}"
- Restart Home Assistant or reload your automations and REST commands.
- Sentinel will now receive and analyze your smart home logs in real-time!
☁️ Nextcloud Integration
Find the active nextcloud.log in Docker volumes:
sudo find /var/lib/docker/volumes/ -name "nextcloud.log" -exec ls -lh {} +
🛠️ Configuration
Sentinel is highly customizable via the Configuration page:
- AI Model: Pick one of the recommended models or any model from Ollama, and the context size.
- Notifications: Email (SMTP), Apprise or Discord.
- Sources: Syslog receiver and relay.
- Diagnostics: Read-only access for the chat AI to your containers and servers.
- Data: Retention, backups and restore.
The full guide is in the documentation.
💻 Local Development
If you want to run Log to LLM Sentinel locally for development without Docker:
1. Prerequisites
- Python: Version 3.10 or higher.
- Ollama: Installed and running locally (for the AI analysis).
2. Setup
- Clone the repository and navigate to it:
git clone https://github.com/Aschefr/log-to-llm-sentinel cd log-to-llm-sentinel - Create and activate a Python virtual environment:
python -m venv .venv # On Windows (PowerShell) .\.venv\Scripts\Activate.ps1 # On Linux/macOS source .venv/bin/activate - Install the dependencies:
pip install -r requirements.txt - Copy the environment configuration template:
cp .env.example .env
3. Run the Server
Launch the FastAPI development server:
uvicorn app.main:app --reload --port 10911
The application will be accessible at: 👉 http://localhost:10911
📄 License
This project is licensed under the MIT License - see the LICENSE file for details.
🤝 Support & Contribution
If you encounter an issue or have a suggestion, feel free to open an issue on the repository.
Log to LLM Sentinel — Because logs are meant to be understood, not just stored.
Media gallery
1 / 5Categories
Download Statistics
Related apps
Explore more like this
Explore allLinks
Details
aschefr/log-to-llm-sentinel:latestRuntime arguments
- Web UI
http://[IP]:[PORT:10911]/- Network
bridge- Shell
bash- Privileged
- false
Template configuration
Web interface port
- Target
- 10911
- Default
- 10911
- Value
- 10911
UDP Syslog receiver port
- Target
- 514
- Default
- 10514
- Value
- 10514
Database and application settings
- Target
- /app/data
- Default
- /mnt/user/appdata/log-to-llm-sentinel/data
- Value
- /mnt/user/appdata/log-to-llm-sentinel/data
Shared logs folder for temp files
- Target
- /logs
- Default
- /mnt/user/appdata/log-to-llm-sentinel/logs
- Value
- /mnt/user/appdata/log-to-llm-sentinel/logs
Read-only access to Unraid Docker logs
- Target
- /docker-logs
- Default
- /var/lib/docker/containers
- Value
- /var/lib/docker/containers
Read-only access to Unraid system logs
- Target
- /system-logs
- Default
- /var/log
- Value
- /var/log
Directories the UI file browser is allowed to explore
- Target
- SENTINEL_BROWSE_ROOTS
- Default
- /logs,/app/data,/docker-logs,/system-logs
- Value
- /logs,/app/data,/docker-logs,/system-logs
Host IP for the Syslog relay / UI display (optional)
- Target
- SENTINEL_HOST_IP