
All apps · 0 apps
HA-Dashboard
Docker app from Tjindarr's Repository
Overview
Readme
View on GitHub🏠 HomeDash
A high-density Home Assistant dashboard for wall-mounted displays. Built with React, Vite, and Tailwind CSS.
Pre-built images are published to GitHub Container Registry: ghcr.io/tjindarr/family-hub-display:latest
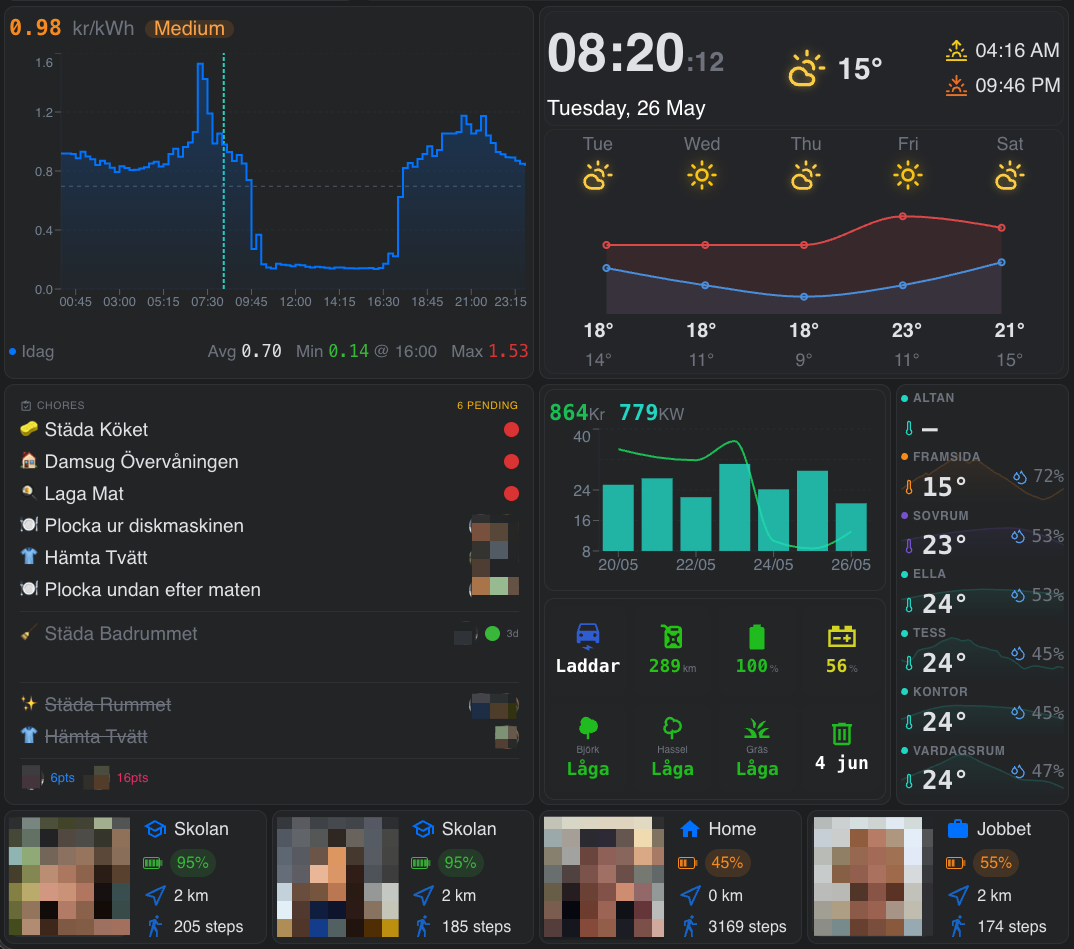
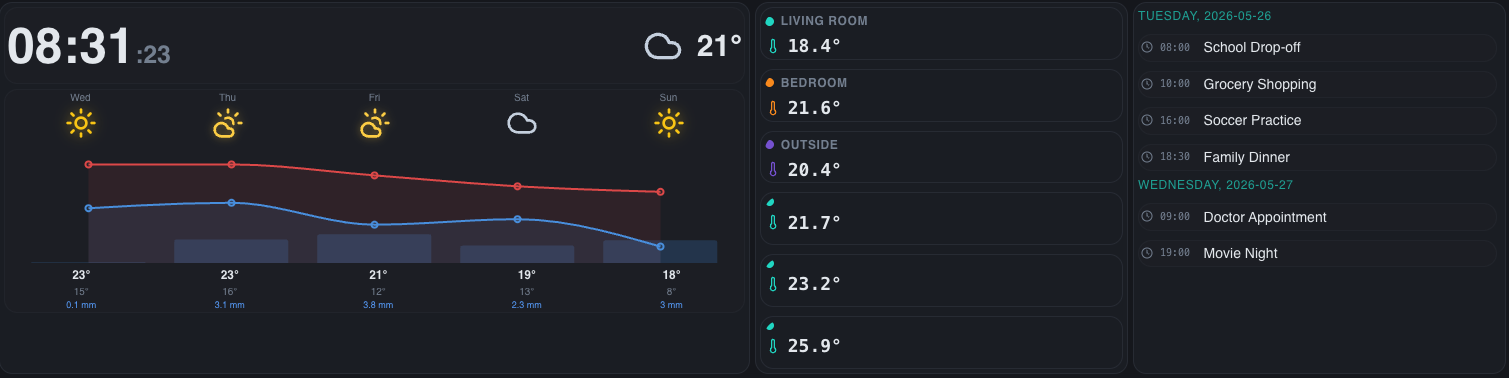
📸 Screenshots
Main Dashboard
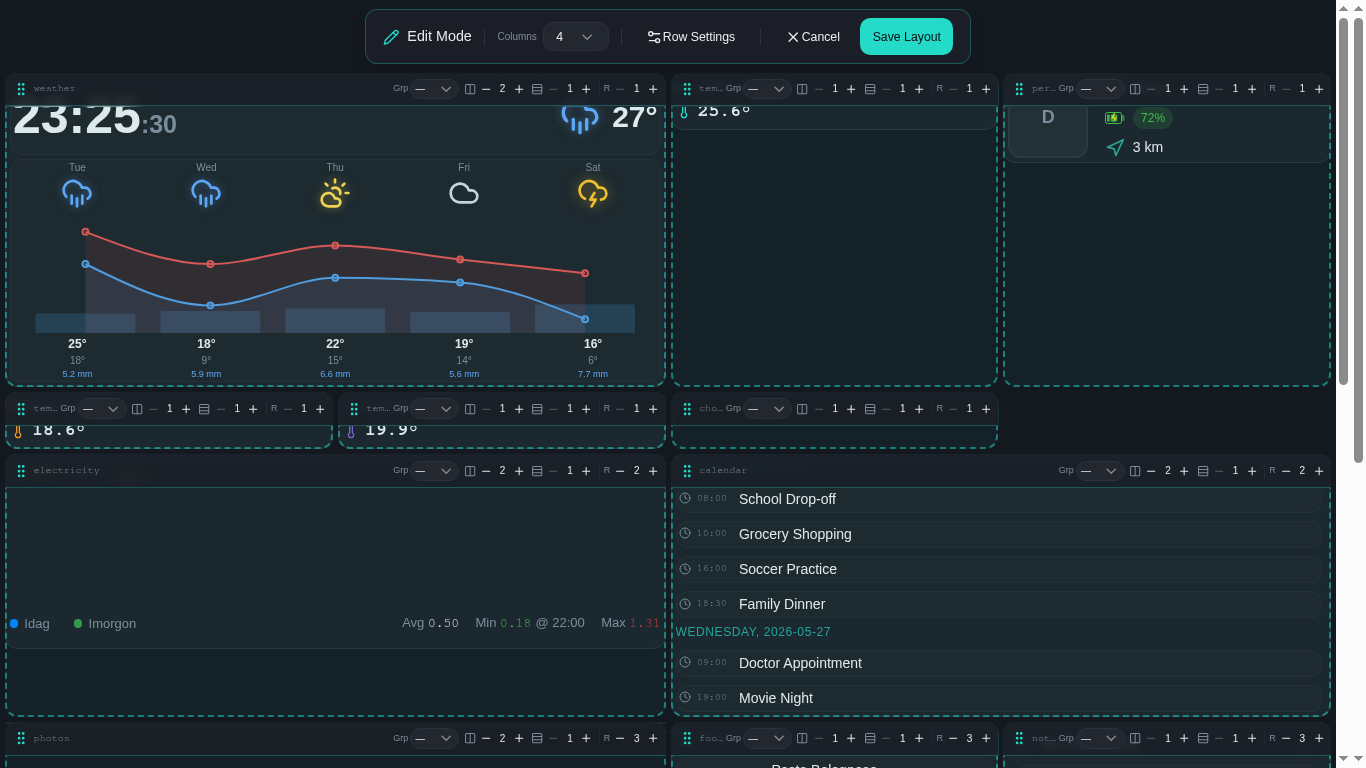
Edit Layout Mode
Dashboard Settings
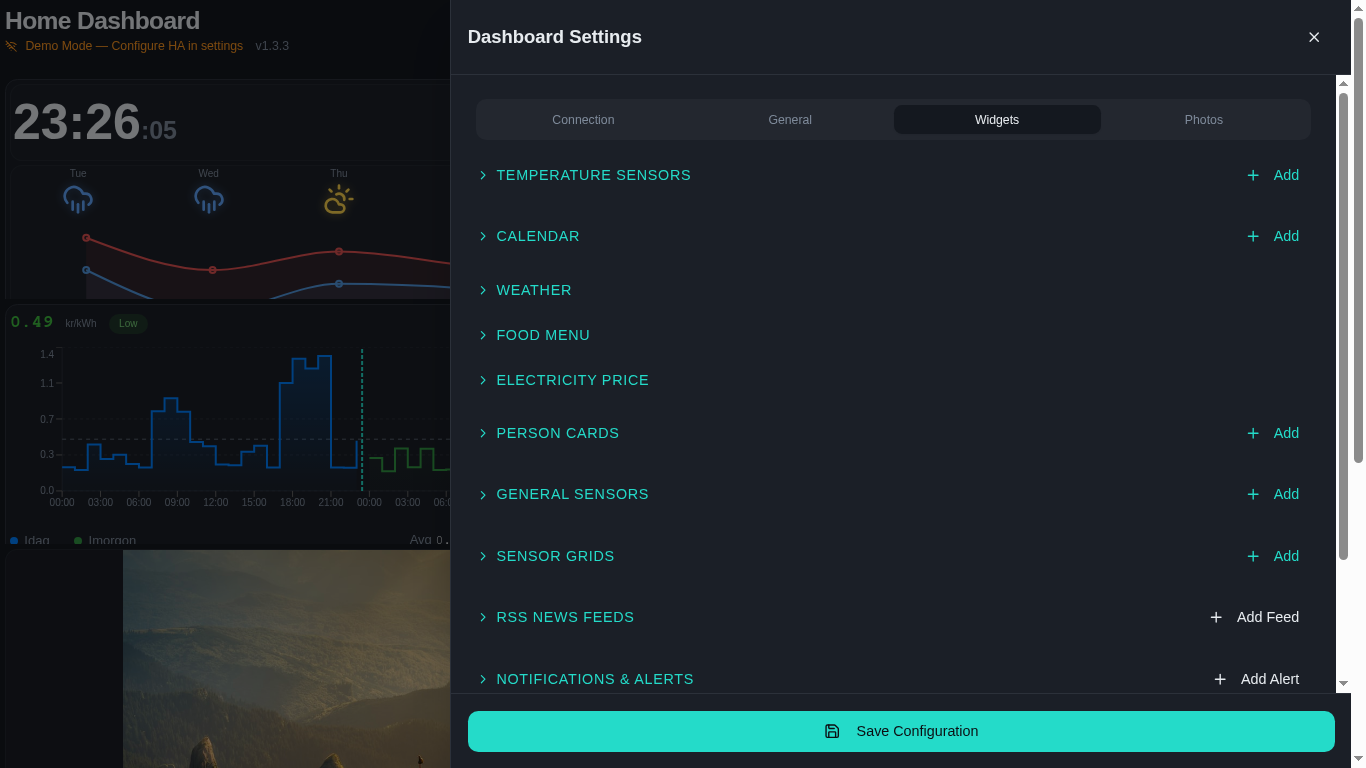
📦 Installation
Docker (Recommended)
docker run -d \
  --name homedash \
  -p 8087:80 \
  -v /path/to/appdata/homedash:/data \
  --restart unless-stopped \
  ghcr.io/tjindarr/family-hub-display:latest
Or with docker compose:
services:
  homedash:
    image: ghcr.io/tjindarr/family-hub-display:latest
    container_name: homedash
    ports:
      - "8087:80"
    volumes:
      - ./data:/data
    restart: unless-stopped
Dashboard available at http://localhost:8087. Config, chores, and photos persist in the mounted /data volume.
Unraid (Community Applications)
The easiest way to install on Unraid is via the bundled CA template.
In Unraid, open the Apps tab → Install from URL (or paste this template URL into a new container):
https://raw.githubusercontent.com/Tjindarr/family-hub-display/main/templates/ha-dashboard.xmlDefaults are already set:
Field Value Name ha-dashboardRepository ghcr.io/tjindarr/family-hub-display:latestWebUI Port Host 8087→ Container80Appdata /mnt/user/appdata/ha-dashboard→/dataClick Apply — dashboard available at
http://<UNRAID_IP>:8087.
Persistence:
/datastoresconfig.json,chores.json, photos, and VAPID push keys. Mapping it to/mnt/user/appdata/ha-dashboardensures data survives container updates.
Manual / Development
Requires Node.js 18+.
npm install
npm run dev          # development server (frontend only)
npm run build        # production build
node server.js       # production server (frontend + API)
Building Your Own Image
The repo includes a GitHub Actions workflow (.github/workflows/docker-publish.yml) that automatically builds and pushes to GHCR on every push to main and on version tags (v1.2.3). To build locally instead:
docker build -t homedash .
docker run -d -p 8087:80 -v $(pwd)/data:/data homedash
⚙️ Initial Setup
- Open the dashboard and click the ⚙️ gear icon (top-right)
- Go to the Connection tab
- Enter your Home Assistant URL (e.g.
http://192.168.1.100:8123) - Enter a Long-Lived Access Token (HA → Profile → Security → Long-Lived Access Tokens)
- Set Refresh Interval (seconds between REST data fetches, default: 30)
- Click Save
CORS: Direct browser communication with the HA REST API requires adding your dashboard origin to
cors_allowed_originsin HA'sconfiguration.yaml.
🔌 Technical Architecture
Communication with Home Assistant
HomeDash uses a hybrid WebSocket + REST approach:
WebSocket (real-time state)
- Connects via
ws://orwss://to/api/websocket - Authenticates with the long-lived access token
- Fetches all entity states on connect via
get_states - Subscribes to
state_changedevents for instant updates - Sends keepalive pings every 30 seconds
- Auto-reconnects with exponential backoff (up to 30s delay)
- A
__bulk_load__signal is emitted after initial state fetch to trigger all data hooks to refresh
REST API (history, calendars, weather)
Used for data that WebSocket doesn't provide:
| Endpoint | Purpose | Refresh Interval |
|---|---|---|
GET /api/history/period/{start} |
Sensor history (charts) | Every 5 minutes |
GET /api/calendars/{entity}?start=&end= |
Calendar events | Config interval |
POST /api/services/weather/get_forecasts |
Weather forecast | Every 30 minutes |
All REST requests use Authorization: Bearer <token> headers. Calendar date parameters omit milliseconds for HA 2026.2+ compatibility.
Connection Status
A dynamic status indicator in the header reflects the WebSocket state: connecting, connected, or disconnected.
Entity Attribute Access
All entity ID fields across every widget support dot-notation attribute access:
sensor.phone.battery_level
Format: domain.object_id.attribute_name
sensor.temperature→ returns the entity's main statesensor.phone.battery_level→ returns thebattery_levelattribute fromsensor.phone
This works in temperature sensors, sensor grids, general sensor cards, vehicle widgets, person cards, notification rules, and pollen sensors.
Server-Side API (Express)
The built-in Express server (port 80 in Docker) provides:
| Endpoint | Method | Description |
|---|---|---|
/api/config |
GET | Load dashboard configuration |
/api/config |
PUT | Save dashboard configuration (JSON body) |
/api/config/backups |
GET | List configuration backups |
/api/config/backups/restore/:file |
POST | Restore a config backup |
/api/photos |
GET | List uploaded photos |
/api/photos/upload |
POST | Upload photos (JSON with base64 files array) |
/api/photos/file/:name |
GET | Serve full-size photo |
/api/photos/thumb/:name |
GET | Serve thumbnail |
/api/photos/:name |
DELETE | Delete a photo |
/api/rss?url= |
GET | RSS feed proxy (avoids CORS) |
/api/push/vapid-public-key |
GET | Get VAPID public key for push subscriptions |
/api/push/subscribe |
POST | Register push notification subscription |
/api/push/unsubscribe |
POST | Remove push notification subscription |
/api/push/test |
POST | Send a test push notification |
Configuration Persistence
- Server-side (primary): Stored as
/data/config.jsonvia the Express API - localStorage (fallback): Used when server API is unavailable
- External backend (optional): Custom REST endpoint configurable in Connection settings
📐 Layout System
Layout is managed through the interactive Edit Layout mode (click the edit icon in the header).
Grid Structure
- Row-based grid with 5px spacing between widgets and page edges
- Each widget has a row assignment, column span, and row span
- The last widget in each row auto-stretches to fill remaining space
- Rows without a defined height default to 120px minimum
- Lock Widget Heights: When enabled, prevents widgets from expanding beyond their grid cell height
Edit Layout Mode
Provides drag-and-drop reordering plus explicit controls for:
- Column and row spans per widget
- Row assignments
- Global grid column count (1–6)
- Per-row column overrides
- Widget grouping (group ID A–H)
Widget Grouping
Widgets with the same group ID (A–H) stack vertically inside a shared card. The first widget in the group defines the card's grid dimensions. In Edit Layout mode, groups move as a single unit.
🎨 General Settings
Themes
Seven themes optimized for always-on displays:
| Theme | Description |
|---|---|
| Midnight Teal | Dark background with teal accents |
| Charcoal | Neutral dark grey tones |
| Deep Ocean | Deep blue palette |
| Warm Ember | Dark with warm orange/amber accents |
| AMOLED Black | Pure black for OLED screens |
| macOS Dark | Dark gray with blue accent |
| Liquid Glass | Translucent glass-like cards with 22px backdrop-blur and softened borders — pairs well with a Wallpaper background |
Wallpaper
Settings → General → Wallpaper: upload a background image rendered behind all widgets on the main dashboard and (optionally) the mobile page.
| Setting | Description |
|---|---|
| Enabled | Toggle wallpaper on/off |
| Image | Upload any image (stored under /data) |
| Fit | cover, contain, fill, or tile |
| Dim | 0–100% darken overlay |
| Blur | 0–40 px background blur |
| Apply to Mobile | Also use on /mobile page |
Global Font Sizes
Four text roles sized independently (px):
| Role | Default | Usage |
|---|---|---|
| Heading | 12 | Section headers, widget titles |
| Value | 18 | Primary data values |
| Body | 14 | Readable text, descriptions |
| Label | 10 | Small labels, units, timestamps |
Per-widget font size overrides are available in each widget's settings.
Date & Time Format
- Date format:
yyyy-MM-dd,dd/MM/yyyy,MM/dd/yyyy,dd.MM.yyyy - Time format:
24hor12h
Screen Blackout
Turns the screen black during a configurable time window (e.g. 23:00–06:00). Only active in kiosk mode.
Kiosk Mode
Append ?kiosk to the URL to hide settings UI. Triple-click anywhere to exit. Can also be entered via the monitor icon in the header.
🧩 Widgets
🕐 Clock & Weather
Displays current time, date, outdoor temperature, and a multi-day forecast chart.
| Setting | Description |
|---|---|
| Weather Entity | weather.* entity from HA |
| Forecast Days | Number of days to forecast (1–7) |
| Show Precipitation | Toggle precipitation bars on chart |
| Show Sunrise | Toggle sunrise time display |
| Show Sunset | Toggle sunset time display |
| Show Date | Toggle date display |
Styling options: Clock text size/color, temperature text size/color, sun icon size/color/text size/color, date text size/color, chart day text size/color, chart icon size.
📅 Calendar
Shows upcoming events from one or more HA calendar entities.
Per-entity settings:
| Setting | Description |
|---|---|
| Entity ID | calendar.* entity |
| Prefix | Text prepended to event names |
| Color | Event text color (HSL) |
| Forecast Days | Per-entity override for days to show |
Display settings:
| Setting | Description |
|---|---|
| Global Forecast Days | Default days to show (default: 7) |
| Day Label Color | Override color for day headers |
| Time Color | Override color for timestamps |
| Show Event Body | Toggle event description |
| Show End Date | Toggle end date/time |
| Hide All-Day Text | Hide "All day" label |
| Hide Clock Icon | Hide clock icon on timed events |
| Show Week Number | Show ISO week number in day headers |
| First Day of Week | Sunday (0), Monday (1), or Saturday (6) |
Font sizes: Day, Time, Title, Body (independent px values).
🌡️ Temperature Sensors
Displays temperature and optional humidity with colored labels. Sensors with the same Group number render together in one widget.
| Setting | Description |
|---|---|
| Entity ID | sensor.* temperature entity |
| Humidity Entity | Optional humidity sensor |
| Label | Display name |
| Color | Sensor color (HSL) |
| Group | Group number (same = grouped together) |
| Show Chart | Toggle 24h history chart |
| Chart Type | Line, Bar, Area, Step, or Scatter |
| Round Temperature | Round to nearest integer |
Styling: Icon size, icon color, secondary icon color, label color, value color, label text size, value text size, humidity text size.
⚡ Electricity Prices
48-hour stepline chart showing Nordpool electricity prices with current price, daily min/max, and Low/Medium/High badge.
| Setting | Description |
|---|---|
| Price Entity | Nordpool sensor.* entity |
| Forecast Entity | Optional forecast entity for tomorrow |
| Surcharge | kr/kWh added to all prices |
Styling: Price text size/color, unit text size/color, stats text size/color, axis text size/color.
👤 Person Tracking
Two-column card with avatar, battery level (with charging indicator), location, and distance from home.
| Setting | Description |
|---|---|
| Name | Display name |
| Entity Picture | URL to avatar image |
| Location Entity | device_tracker.* or person.* entity |
| Battery Entity | Battery level sensor |
| Battery Charging Entity | Binary sensor for charging state |
| Distance Entity | Distance from home sensor |
| Distance Unit | km, m, mi, or auto (default: auto) |
| Avatar Size | Avatar diameter in px (default: 80) |
Custom Sensors (optional): Add extra entity readings below the main info. Each custom sensor has an entity ID, MDI icon, optional label, and optional attribute key.
Font sizes: Location, Battery, Distance (independent px values).
🍽️ Food Menu
Displays upcoming meals from a calendar entity or Skolmaten sensor.
| Setting | Description |
|---|---|
| Source | calendar or skolmaten |
| Calendar Entity | Calendar entity for meal events |
| Skolmaten Entity | Sensor entity for Skolmaten integration |
| Days | Days to display (1–14, default: 5) |
| Skip Weekends | Skip Saturday/Sunday |
| Display Mode | compact (side-by-side) or menu (restaurant style) |
| Show Title | Show "MENU" title with icon |
Styling: Day color, date color, meal color, day/date/meal font sizes, day/meal font families.
📊 General Sensor Card
Versatile widget with icon, label, top/bottom info rows (up to 4 sensors each), and a historical chart with multiple series.
| Setting | Description |
|---|---|
| Label | Card title |
| Show Label | Toggle label visibility |
| Icon | Icon name (MDI format, e.g. mdi:thermometer) |
| Icon Size | Icon size in px (default: 20) |
| Show Graph | Toggle history chart |
| History Hours | Data range: 1, 6, 24, or 168 hours |
| Chart Grouping | Aggregate by minute, hour, or day |
| Chart Aggregation | Combine method: average, max, min, sum, last, delta |
Chart series (multiple): Entity, label, color, chart type (line/bar/area/step/scatter).
Top/Bottom info (up to 4 each): Entity, label, unit, color.
Per-widget font sizes: Heading, value, body, label.
Delta Aggregation & Meter Resets
When using delta aggregation (common for cumulative energy meters), the chart calculates the difference between consecutive time buckets. If a negative delta is detected (e.g. a meter resetting at the start of a new month), the chart automatically treats the new value as the delta instead of showing a large negative spike.
🔲 Sensor Grid
Configurable grid (up to 6×6) of sensor cells with icons, labels, values, and conditional formatting.
Grid settings:
| Setting | Description |
|---|---|
| Rows / Columns | Grid dimensions (1–6 each) |
Per-cell settings:
| Setting | Description |
|---|---|
| Entity ID | Sensor entity |
| Label | Cell label |
| Icon | Icon name |
| Unit | Display unit |
| Color | Default icon color |
| Value Color | Separate value text color (falls back to icon color) |
| Icon Size | Icon size in px (default: 16) |
| Font Size | Value font size in px |
| Label Font Size | Label font size in px |
| Col Span / Row Span | Cell spanning (default: 1) |
| Order | CSS order for custom positioning |
| Show Chart | Background history chart |
| Chart Type | Chart type for background (default: line) |
| Use Intervals | Enable conditional icon/color by value |
| Intervals | 4 numeric ranges with conditional icon + color |
| Value Maps | String rewrite rules (from → to, with optional icon/color) |
| Visibility Filter | Conditionally hide cell (range or exact match) |
🚗 Vehicle
Customizable vehicle monitoring card with sections for battery, fuel, location, climate, doors, tires, or custom data.
| Setting | Description |
|---|---|
| Name | Vehicle name (e.g. "My Tesla") |
| Icon | MDI icon (e.g. mdi:car-electric) |
Per-section: Type (battery/fuel/location/climate/doors/tires/custom), label, and entity list.
Per-entity: Entity ID, label, icon, unit, color.
Styling: Icon size, icon color, label color, value color, heading color.
Battery/fuel sections show percentage progress bars. Door sections use green/red coloring for locked/unlocked states.
📰 RSS News
Single-item carousel cycling through headlines from an RSS feed.
| Setting | Description |
|---|---|
| Label | Feed name |
| Feed URL | URL to RSS/Atom feed |
| Max Items | Maximum headlines (default: 15) |
Feeds are fetched via server-side proxy (
/api/rss) to avoid CORS issues.
🔔 Notifications
Displays Home Assistant persistent notifications and custom sensor-based alert rules.
| Setting | Description |
|---|---|
| Show HA Notifications | Toggle persistent_notification display |
Alert rules (multiple):
| Setting | Description |
|---|---|
| Entity ID | Sensor to monitor |
| Label | Alert label |
| Condition | above, below, or equals |
| Threshold | Numeric threshold value |
| Icon | Icon name |
| Color | Alert color |
| Icon Size | Icon size in px |
| Label Color | Label text color |
| Value Color | Value text color |
🖼️ Photo Gallery
Rotating photo slideshow with configurable display modes and transition effects. Photos stored server-side in /data/photos/.
| Setting | Description |
|---|---|
| Interval | Seconds between photo transitions |
| Display Mode | contain (fit, letterboxed), cover (fill + crop), blur-fill (centered with blurred background) |
| Transition | none, fade, slide, zoom, flip, blur |
Manage photos in Settings → Photos tab (upload, sort, delete). Photos can be sorted by newest, oldest, largest, or smallest.
⚡ Quick Actions
Grid of tappable buttons that fire Home Assistant actions. Each button supports three action types:
- Toggle — calls
homeassistant.toggleon any entity (lights, switches, fans, covers, etc.) - Service — calls any service with custom data (e.g.
script.movie_night,scene.turn_on) - Navigate — opens a URL or internal route
| Setting | Description |
|---|---|
| Label | Card title |
| Columns | 1–6 button columns |
| Buttons | Label, MDI icon, color, optional confirmation prompt |
| State Entity | Optional entity for live state coloring |
| Active / Inactive Color | Foreground color in each state |
| Active / Inactive BG Color | Background color in each state |
| Active Icon | Optional icon swap when state is active |
| Active States | Override list of state values considered "on" |
Default active states: on, open, home, playing, heat, cool, active, unlocked, true.
📷 Camera Grid
Grid of Home Assistant camera snapshots, pulled via the camera proxy on a configurable interval. Tap any tile to open fullscreen.
| Setting | Description |
|---|---|
| Label | Card title |
| Columns | 1–6 columns |
| Aspect Ratio | 16:9, 4:3, 1:1, or 3:2 |
| Refresh Seconds | Snapshot refresh interval (min 2s) |
| Cameras | List of camera.* entities with labels |
📦 Parcel Tracking
Displays undelivered packages from the Home Assistant parcel integration with carrier icons and the latest tracking event per shipment.
| Setting | Description |
|---|---|
| Label | Card title |
| Entity ID | sensor.parcel_* entity provided by the integration |
🔌 Power Flow
Live power consumption widget designed for Shelly / smart-plug fleets. Shows per-device current draw with rolling sparklines, highlights the top consumers, and can show a stacked 24-hour history chart.
| Setting | Description |
|---|---|
| Label | Card title |
| Unit | W (auto-scales to kW above 1000) or kW |
| Top Highlight Count | Number of top consumers to highlight |
| Sparkline Minutes | Length of the rolling sparkline window |
| Show Total | Toggle total power summary |
| Show 24h Chart | Adds a stacked 24-hour history chart |
| 24h Chart Height | Chart height in px (default 80) |
| 24h Chart Stacked | Stacked vs overlaid per-device areas |
| Devices | Power sensor (W), label, optional icon/color, optional kWh-today sensor |
📱 Mobile Dashboard (/mobile)
A standalone PWA route optimized for phones, completely independent from the main dashboard.
- Add any widget type to the mobile page — sensor grids, general sensors, actions, cameras, parcels, power flow, RSS, vehicles, person cards, temperatures, weather, calendar, electricity, photos, food menu, notifications, pollen, chores.
- Mobile-only widget instances (e.g. a compact mobile sensor grid) live separately from the main dashboard so they don't bloat the wall display.
- Singleton widgets (weather, calendar, electricity, photos, food menu, notifications, pollen, chores) can either inherit the main dashboard config or be overridden per-mobile.
- Configure everything in Settings → Mobile tab.
- Installable on iOS / Android as a separate PWA via its own manifest.
🎬 Demo Mode
Append ?demo to the URL (or visit /?demo) to render the dashboard with rich mock data — sample chores, kids, people with avatars, sensor values, camera placeholders (via picsum.photos), power flow waveforms, parcels, and a full default layout. Useful for screenshots and previewing widgets without a configured HA instance.
🌿 Pollen
Displays pollen levels from HA sensors with color-coded severity dots and optional multi-day forecast.
| Setting | Description |
|---|---|
| Show Label | Toggle "Pollen" heading |
| Show Forecast | Toggle forecast dots |
Per-sensor settings:
| Setting | Description |
|---|---|
| Entity ID | Pollen sensor entity |
| Label | Pollen type name (e.g. "Björk") |
| Icon | MDI icon name |
| Color | Icon color |
Styling: Heading font size/color, icon size, label font size, value font size. Per-sensor label/value font size overrides available.
Levels are color-coded from green (none) through yellow/orange (moderate) to red (high/very high).
✅ Chore System
A gamified chore management system for families with separate Parent (/parent) and Kids (/kids) pages.
Parent Page (/parent)
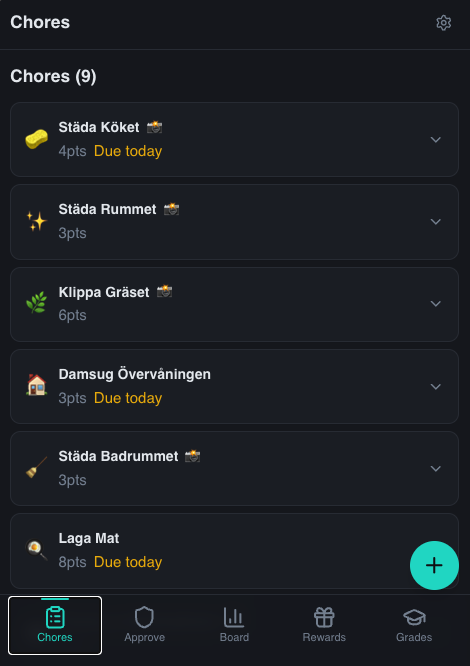
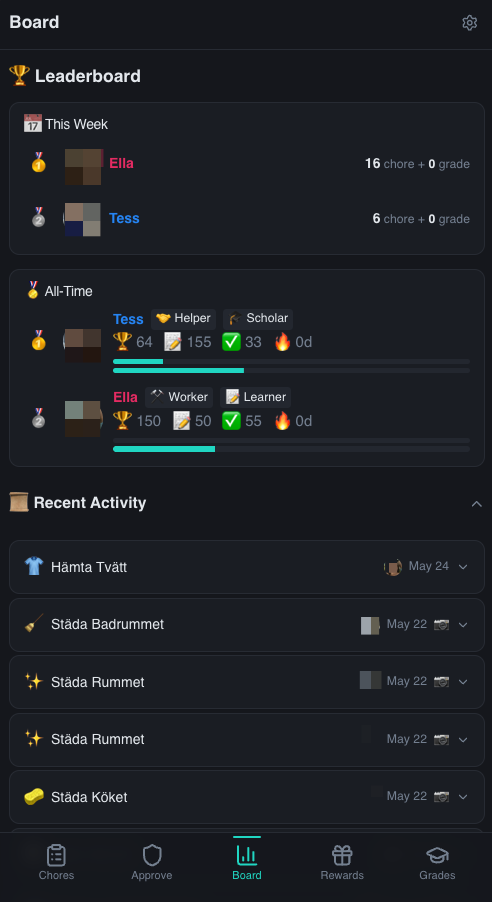
Manage kids, chores, rewards, approvals, grades, and settings via a hamburger-menu navigation with the following tabs:
| Tab | Description |
|---|---|
| Chores | Create, edit, pause, and delete chores. Assign difficulty, points, recurrence, deadlines, and photo/approval requirements |
| Kids | Add/remove kids with custom avatars (emoji or uploaded image) and colors. View points, streaks, levels, and badges |
| Rewards | Define rewards kids can redeem with earned points (combined chore + grade points) |
| Leaderboard | View streaks, weekly/total points, chore/academic levels, and progress bars for all kids |
| Approvals | Review pending chore completions, custom chore submissions, and grade submissions from kids |
| Grades | Add and manage school grades with configurable point rewards per grade level |
| History | Browse all completed chores with filters by kid and date |
| Settings | Configure rotation, categories, streak bonuses, notifications, daily/streak reminders, grades, and timezone |
Kids Page (/kids)
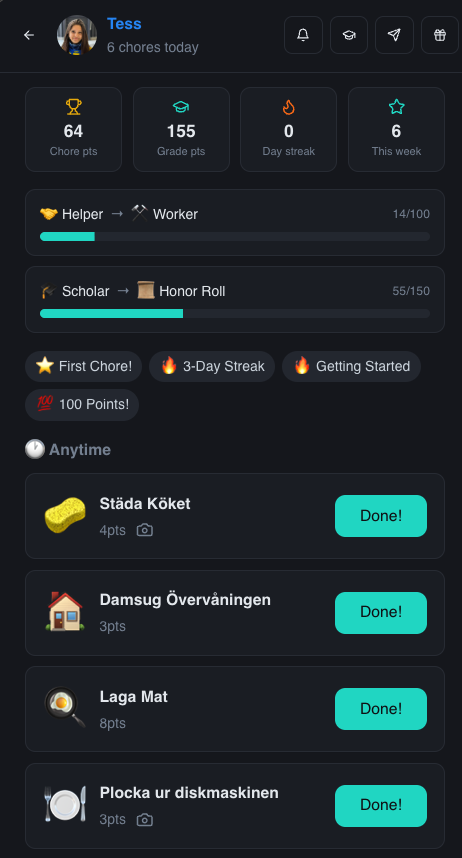
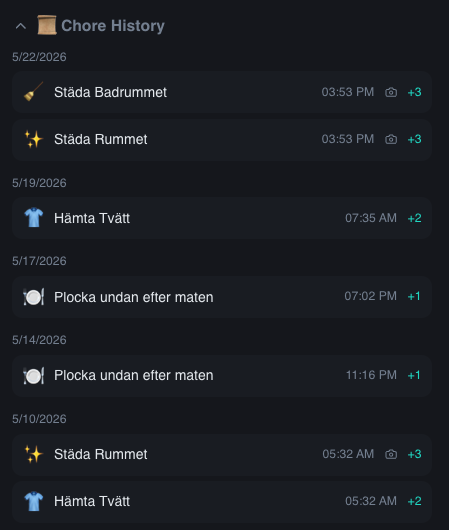
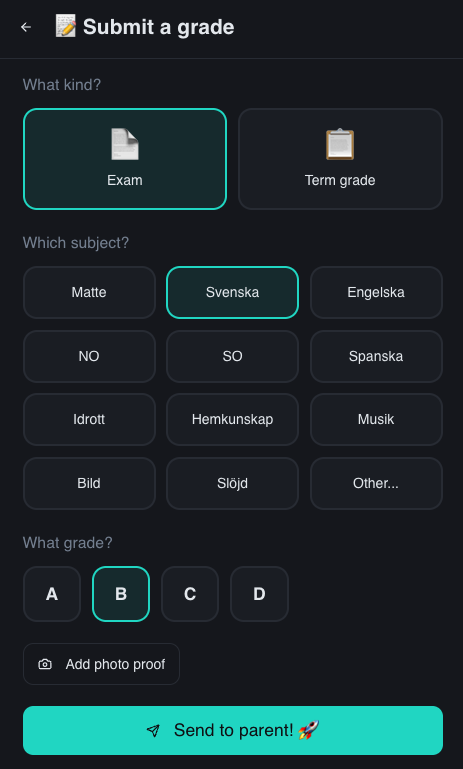
Kid-facing interface optimized for simplicity:
- Kid picker on launch — each kid sees only their chores
- Today's chores grouped by time of day (Morning, Afternoon, Evening, Anytime)
- One-tap completion with optional photo capture and completion popup messages
- Custom chore submissions — kids can suggest chores with text description and mandatory photo proof for parent approval
- Grade submissions — kids can submit exam/term grades with subject, grade, and optional photo proof
- Rewards shop — redeem earned points (combined chore + grade points) for configured rewards
- Progress tracking — 4-column stats bar (Chore pts, Grade pts, Day streak, Weekly), dual progress bars for Chore and Academic levels, badge collection
- My Submissions section showing pending/approved/rejected submissions (rejected auto-hidden after 7 days)
Chore Configuration
| Setting | Description |
|---|---|
| Title & Icon | Display name and emoji icon |
| Points | Base points earned on completion |
| Difficulty | 1–5 star rating |
| Time of Day | Morning, Afternoon, Evening, or Anytime |
| Recurrence | Once, Daily, Every X days, or Weekly (specific days) |
| Deadline | Optional HH:MM deadline with early completion bonus |
| Require Photo | Kid must attach a photo when completing |
| Require Approval | Parent must approve before points are awarded |
| Per Kid | Each kid can complete independently |
| Rotation | Auto-rotate assignment among selected kids |
| Category | Optional tag (when categories are enabled) |
| Completion Popup | Optional custom message shown when kid marks task as done, requiring acknowledgment |
Categories
Categories (e.g. Kitchen, Bedroom, Outdoor) are optional and off by default. Enable in Settings → Categories toggle. When enabled, chores can be tagged and filtered by category. Categories are only visible on the kids page when enabled.
School Grades
Optional school grades tracking integrated with the points system. Enable in Parent → Settings → School Grades.
- Grade Scale: Parent-configurable grading scale with point rewards per grade level (e.g. A → 10pts, B → 7pts)
- Subjects: Configurable list of school subjects
- Grade Types: Exam grades and term grades
- Academic Leveling: Separate 7-tier progression (Student → Genius) with 6 academic-specific badges (e.g. Scholar Elite)
- Privacy: Grades and academic levels are only visible to parents and the specific child they belong to
- Kid Submissions: Kids can submit grades with subject, grade level, and optional photo proof for parent approval
- Approved grades automatically award points by generating virtual
grade_chore entries (filtered from the Chores tab)
Grade points are tracked separately for leveling but combined with chore points for reward purchasing power.
Streak Bonuses
Configurable point multipliers that activate when a kid maintains a daily streak:
| Example Config | Effect |
|---|---|
| 7 days → 2x | After 7 consecutive days, all points are doubled |
| 14 days → 3x | After 14 consecutive days, all points are tripled |
The highest qualifying tier applies. Streak bonuses are configured in Parent → Settings → Streak Bonuses. Multipliers are applied automatically on chore completion.
Leveling System
Kids level up based on total chore points earned:
| Level | Icon | Points Required |
|---|---|---|
| Beginner | 🌱 | 0 |
| Helper | 🤝 | 50 |
| Worker | ⚒️ | 150 |
| Pro | ⭐ | 350 |
| Expert | 💎 | 700 |
| Master | 👑 | 1,500 |
| Legend | 🏆 | 3,000 |
Badges
Automatic achievements awarded for milestones:
- Chore count: 1, 10, 50, 100 chores completed
- Streak days: 3, 7, 30 consecutive days
- Total points: 100, 500 points earned
- Grade milestones: Total grades logged, grade points earned (e.g. Scholar Elite)
Data Storage
Chore data is stored server-side at /data/chores.json via the Express API:
| Endpoint | Method | Description |
|---|---|---|
/api/chores |
GET | Load all chore data |
/api/chores/kids |
POST | Add a kid |
/api/chores/kids/:id |
PUT | Update a kid |
/api/chores/kids/:id |
DELETE | Delete a kid |
/api/chores/chores |
POST | Add a chore |
/api/chores/chores/:id |
PUT | Update a chore |
/api/chores/chores/:id |
DELETE | Delete a chore |
/api/chores/logs |
POST | Complete a chore |
/api/chores/logs/:id/approve |
PUT | Approve a completion |
/api/chores/logs/:id/undo |
PUT | Undo a completion |
/api/chores/logs/:id |
DELETE | Delete a log entry |
/api/chores/rewards |
POST | Add a reward |
/api/chores/rewards/:id |
PUT | Update a reward |
/api/chores/rewards/:id |
DELETE | Delete a reward |
/api/chores/rewards/claim |
POST | Claim a reward |
/api/chores/submissions |
POST | Submit a custom chore (kid) |
/api/chores/submissions/:id/approve |
PUT | Approve a submission |
/api/chores/submissions/:id/reject |
PUT | Reject a submission |
/api/chores/grades |
POST | Add a grade |
/api/chores/grades/:id |
PUT | Update a grade |
/api/chores/grades/:id |
DELETE | Delete a grade |
/api/chores/grade-submissions |
POST | Submit a grade (kid) |
/api/chores/grade-submissions/:id/approve |
PUT | Approve a grade submission |
/api/chores/grade-submissions/:id/reject |
PUT | Reject a grade submission |
/api/chores/settings |
PUT | Update chore settings |
Push Notifications
HomeChores supports real-time push notifications via the Web Push API. Notifications are sent to parents when kids complete or submit chores/grades, and to kids when their submissions are approved or rejected.
Requirements
Push notifications require HTTPS with a valid SSL certificate. Service Workers and the Push API are only available in secure contexts. There are several ways to set this up:
Option 1: Nginx Reverse Proxy with Let's Encrypt (Recommended)
server {
    listen 80;
    server_name homedash.yourdomain.com;
    return 301 https://$host$request_uri;
}

server {
    listen 443 ssl;
    server_name homedash.yourdomain.com;

    ssl_certificate /etc/letsencrypt/live/homedash.yourdomain.com/fullchain.pem;
    ssl_certificate_key /etc/letsencrypt/live/homedash.yourdomain.com/privkey.pem;

    location / {
        proxy_pass http://localhost:3000;
        proxy_http_version 1.1;
        proxy_set_header Upgrade $http_upgrade;
        proxy_set_header Connection "upgrade";
        proxy_set_header Host $host;
        proxy_set_header X-Real-IP $remote_addr;
        proxy_set_header X-Forwarded-For $proxy_add_x_forwarded_for;
        proxy_set_header X-Forwarded-Proto $scheme;
    }
}
Generate certificates with Certbot:
sudo apt install certbot python3-certbot-nginx
sudo certbot --nginx -d homedash.yourdomain.com
Option 2: Nginx Proxy Manager (Unraid / NAS)
If you run Unraid or a NAS with Nginx Proxy Manager:
- Add a new Proxy Host pointing to your HomeDash container IP and port (e.g.
192.168.1.50:3000) - Set the domain to your chosen hostname (e.g.
homedash.yourdomain.com) - Go to the SSL tab → select "Request a new SSL Certificate" with Let's Encrypt
- Enable Force SSL and WebSocket Support
Option 3: Caddy (Automatic HTTPS)
Caddy automatically provisions Let's Encrypt certificates:
homedash.yourdomain.com {
    reverse_proxy localhost:3000
}
Option 4: Cloudflare Tunnel
If you don't want to open ports, use a Cloudflare Tunnel:
- Install
cloudflaredon your server - Create a tunnel:
cloudflared tunnel create homedash - Configure it to route your domain to
http://localhost:3000 - Cloudflare handles SSL automatically
Setting Up Notifications
- Ensure HomeDash is accessible over HTTPS
- Enable HomeChores in Settings → General
- Open the Parent (
/parent) or Kids (/kids) page - Toggle the 🔔 notification bell to subscribe
- Accept the browser notification permission prompt
iOS (iPhone/iPad): Push notifications require iOS 16.4+ and the page must be installed as a PWA ("Add to Home Screen" from Safari). Push notifications do not work in regular Safari tabs.
Daily Chore Reminders
A configurable daily push notification sent to all kid subscribers listing today's scheduled chores. Configure in Parent → Settings:
| Setting | Default | Description |
|---|---|---|
| Enable reminder | Off | Master toggle for daily reminders |
| Timezone | Auto-detected | IANA timezone for hour calculations (e.g. Europe/Stockholm) |
| Weekday hour | 16 | Hour (0–23) to send on Mon–Fri |
| Weekend hour | 10 | Hour (0–23) to send on Sat–Sun |
| Max chores shown | 3 | Number of chore names in notification body |
Days with no scheduled chores are automatically skipped. The timezone setting ensures reminder hours match your local time regardless of server timezone (Docker defaults to UTC).
Streak Reminders
An optional push notification sent to kids who have a streak of 2+ days but haven't completed any chores yet today. Configure in Parent → Settings:
| Setting | Default | Description |
|---|---|---|
| Enable streak reminder | Off | Master toggle |
| Reminder hour | 18 | Hour (0–23) to send the reminder |
Uses the same timezone setting as daily reminders.
Data Files
| File | Description |
|---|---|
/data/vapid-keys.json |
Auto-generated VAPID key pair for push encryption |
/data/push-subscriptions.json |
Active push subscriptions |
💾 Configuration Backups
The server automatically creates timestamped backups of config.json when saving. You can:
- List backups:
GET /api/config/backups - Restore a backup:
POST /api/config/backups/restore/:filename - Import/Export: Use Settings → General → Import/Export to download or upload configuration JSON files
⚠️ Importing replaces your entire configuration. Always export a backup first.
🐳 Docker
services:
  ha-dashboard:
    image: ghcr.io/tjindarr/family-hub-display:latest
    container_name: ha-dashboard
    ports:
      - "8087:80"
    volumes:
      - config-data:/data
    restart: unless-stopped
The /data volume stores config.json, chores.json, photos/, vapid-keys.json, and push-subscriptions.json.
🔧 Troubleshooting
| Issue | Solution |
|---|---|
| Blank dashboard / no data | Verify HA URL and token in Settings → Connection. Check CORS config in HA. |
| WebSocket disconnects | Ensure HA is reachable. Check for reverse proxy WebSocket support (Upgrade headers). |
| CORS errors in console | Add your dashboard origin to cors_allowed_origins in HA's configuration.yaml and restart HA. |
| Photos not loading | Ensure the /data volume is mounted and writable. Check server logs. |
| Push notifications not working | HTTPS is required. Verify SSL cert is valid. On iOS, the page must be installed as a PWA. |
| Daily reminders not firing | Check timezone setting in Parent → Settings. Docker defaults to UTC; set your local IANA timezone. |
| Calendar shows no events | Check entity ID is correct. Verify the calendar has events within the forecast range. |
| Electricity prices missing | Confirm the Nordpool entity exists and has raw_today/raw_tomorrow attributes. |
| Chores not saving | Ensure the /data directory is writable by the container process. |
| Kiosk mode stuck | Triple-click anywhere on the page to exit kiosk mode. |
🛠️ Tech Stack
- Frontend: React 18, TypeScript, Vite, Tailwind CSS
- UI: shadcn/ui, Radix UI
- Charts: Recharts
- Icons: Iconify (MDI)
- Drag & Drop: dnd-kit
- Backend: Express.js
- Deployment: Docker (multi-stage build)
📄 License
MIT
Categories
Related apps
Explore more like this
Explore allDetails
ghcr.io/tjindarr/family-hub-display:latestRuntime arguments
- Web UI
http://[IP]:[PORT:80]/- Network
bridge- Shell
sh- Privileged
- false
Template configuration
HTTP port for the dashboard
- Target
- 80
- Default
- 8087
- Value
- 8087
Persistent config, chores, photos, vapid keys
- Target
- /data
- Default
- /mnt/user/appdata/ha-dashboard
- Value
- /mnt/user/appdata/ha-dashboard