
All apps · 0 apps

Grafana-Unraid-Stack
DeprecatedDocker app from testdasi's Repository
Overview
Readme
View on GitHubDeprecated
In case it hasn't been obvious for quite some time, I have abandoned this project.
Grafana-Unraid-Stack
Meet Gus! He has everything you need to start monitoring Unraid (Grafana - Influxdb - Telegraf - Loki - Promtail). 1 docker instead of 5+!
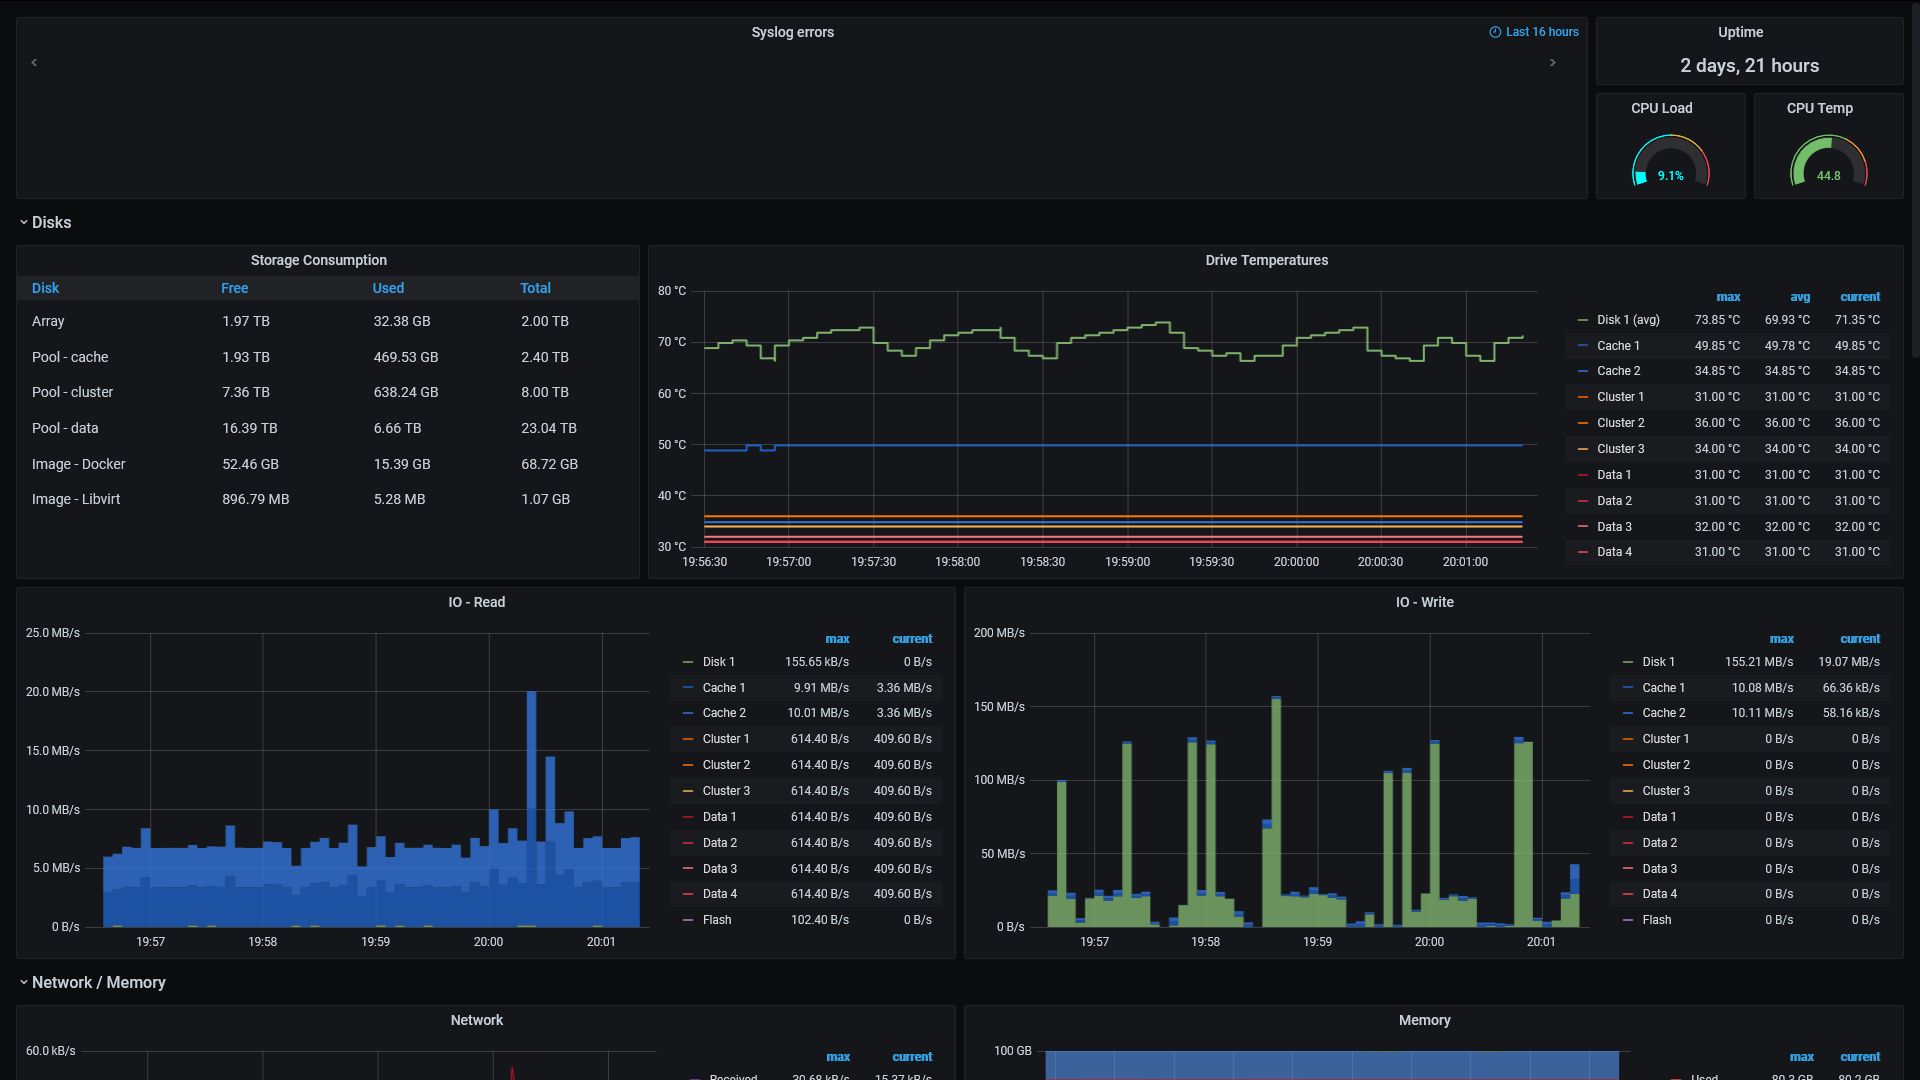
A GUS demo dashboard (preview below) and falconexe's Ultimate UNRAID Dashboard v1.3 (UUD) are included out of the box.
High-level instructions
- Decide whether you want hddtemp or S.M.A.R.T (smartmontools) and set USE_HDDTEMP variable accordingly.
- Hint: both GUS and UUD use S.M.A.R.T.
- Install docker with host network
- Go to ip:3006 to access grafana, login with admin/admin and make changes as required to fit your system.
Key features
- Grafana server. Include both a GUS demo dashboard and falconexe's Ultimate UNRAID Dashboard v1.3.
- Influxdb
- Telegraf with hddtemp or smartmontools (and ipmitool pre-installed)
- Loki + Promtail (so you can now watch your Unraid syslog in the dashboard)
Bits and bobs
- Use port 3006 because grafana default port 3000 is rather popular among other apps
- I highly recommend you don't change the port variables unless you know how to deal with various config files. Things are rather tightly integrated.
- Need to run privileged=true
- Should be run on "Host" network for max exposure to the server network metrics. You can use bridge if you don't care too much about host network reporting (but remember to map port 3006)
- The read-only paths are required for Telegraf to report on host devices.
- Data is separated from config so, for example, you can have the data in RAM so it gets reset after reboot.
- The included dashboards are intentionally not editable (grafana will tell you it's not possible and provide json). There are 2 ways to save your customization:
- Save the json file and overwrite the GUS.json / UUD.json at /config/grafana/data/dashboards/.
- Alternatively, you can copy the json text and import (+ icon -> Import).
- All s-tag builds after 10 March 2022 is based on Ubuntu LTS (instead of Debian Buster).
- For more info about Ultinate UNRAID dashboard, please refer to the official thread.
- Later versions of UUD requires more apps than I yet have time to code for unfortunately.
Usage
docker run -d \
    --name=<container name> \
    --net='host' \
    --privileged=true \
    -v <host path for config>:/config \
    -v <host path for data>:/data \
    -e USE_HDDTEMP=no \
    -e INFLUXDB_HTTP_PORT=8086 \
    -e INFLUXDB_RPC_PORT=58083 \
    -e LOKI_PORT=3100 \
    -e PROMTAIL_PORT=9086 \
    -e GRAFANA_PORT=3006 \
    -v /var/run/utmp:/var/run/utmp:ro \
    -v /var/run/docker.sock:/var/run/docker.sock:ro \
    -v /:/rootfs:ro \
    -v /run/udev:/run/udev:ro \
    -v /sys:/rootfs/sys:ro \
    -v /etc:/rootfs/etc:ro \
    -v /proc:/rootfs/proc:ro \
    -e HOST_PROC=/rootfs/proc \
    -e HOST_SYS=/rootfs/sys \
    -e HOST_ETC=/rootfs/etc \
    -e HOST_MOUNT_PREFIX=/rootfs \
    testdasi/grafana-unraid-stack:<tag>
Unraid example
docker run -d \
    --name='Grafana-Unraid-Stack' \
    --net='host' \
    --privileged=true \
    -v '/mnt/user/appdata/Grafana-Unraid-Stack/config':'/config':'rw' \
    -v '/mnt/user/appdata/Grafana-Unraid-Stack/data':'/data':'rw' \
    -e 'USE_HDDTEMP'='no' \
    -e 'INFLUXDB_HTTP_PORT'='8086' \
    -e 'INFLUXDB_RPC_PORT'='58083' \
    -e 'LOKI_PORT'='3100' \
    -e 'PROMTAIL_PORT'='9086' \
    -e 'GRAFANA_PORT'='3006' \
    -v '/':'/rootfs':'ro' \
    -v '/etc':'/rootfs/etc':'ro' \
    -v '/proc':'/rootfs/proc':'ro' \
    -v '/sys':'/rootfs/sys':'ro' \
    -v '/var/run/docker.sock':'/var/run/docker.sock':'ro' \
    -v '/var/run/utmp':'/var/run/utmp':'ro' \
    -v '/run/udev':'/run/udev':'ro' \
    -e 'HOST_ETC'='/rootfs/etc' \
    -e 'HOST_PROC'='/rootfs/proc' \
    -e 'HOST_SYS'='/rootfs/sys' \
    -e 'HOST_MOUNT_PREFIX'='/rootfs' \
    -e TZ="Europe/London" \
    -e HOST_OS="Unraid" \
    'testdasi/grafana-unraid-stack:stable-amd64'
Notes
- I code for fun and my personal uses; hence, these niche functionalties that nobody asks for. ;)
- If you like my work, a donation to my burger fund is very much appreciated.
 .
.
Categories
Download Statistics
Total Downloads Over Time
Related apps
Explore more like this
Explore allLinks
Details
testdasi/grafana-unraid-stack:latestRuntime arguments
- Web UI
http://[IP]:[PORT:3006]/- Network
host- Shell
bash- Privileged
- true
Template configuration
Container Path: /config
- Target
- /config
- Default
- /mnt/user/appdata/Grafana-Unraid-Stack/config
- Value
- /mnt/user/appdata/Grafana-Unraid-Stack/config
Container Path: /data
- Target
- /data
- Default
- /mnt/user/appdata/Grafana-Unraid-Stack/data
- Value
- /mnt/user/appdata/Grafana-Unraid-Stack/data
Container Variable: USE_HDDTEMP
- Default
- yes|no
- Value
- no
Container Variable: INFLUXDB_HTTP_PORT
- Default
- 8086
- Value
- 8086
Container Variable: LOKI_PORT
- Default
- 3100
- Value
- 3100
Container Variable: PROMTAIL_PORT
- Default
- 9086
- Value
- 9086
Container Variable: GRAFANA_PORT
- Default
- 3006
- Value
- 3006
Container Path: /rootfs
- Target
- /rootfs
- Default
- /
- Value
- /
Container Path: /rootfs/etc
- Target
- /rootfs/etc
- Default
- /etc
- Value
- /etc
Container Path: /rootfs/proc
- Target
- /rootfs/proc
- Default
- /proc
- Value
- /proc
Container Path: /rootfs/sys
- Target
- /rootfs/sys
- Default
- /sys
- Value
- /sys
Container Path: /var/run/docker.sock
- Target
- /var/run/docker.sock
- Default
- /var/run/docker.sock
- Value
- /var/run/docker.sock
Container Path: /var/run/utmp
- Target
- /var/run/utmp
- Default
- /var/run/utmp
- Value
- /var/run/utmp
Container Path: /run/udev
- Target
- /run/udev
- Default
- /run/udev
- Value
- /run/udev
Container Variable: HOST_ETC
- Default
- /rootfs/etc
- Value
- /rootfs/etc
Container Variable: HOST_PROC
- Default
- /rootfs/proc
- Value
- /rootfs/proc
Container Variable: HOST_SYS
- Default
- /rootfs/sys
- Value
- /rootfs/sys
Container Variable: HOST_MOUNT_PREFIX
- Default
- /rootfs
- Value
- /rootfs