
All apps · 0 apps

github-actions-runner-exporter
Docker app from drumandbytes' Repository
Overview
Readme
View on GitHubgithub-actions-runner-exporter
A small Go exporter that polls the GitHub API for an organization's self-hosted Actions runners, plus repo/CI health, PR counts and Dependabot alerts, and exposes it all as Prometheus metrics.
Why
GitHub doesn't publish any of this as metrics itself, and there's no single well-maintained community exporter that covers it. Runner up/busy state is real-time by nature; everything else (CI status, PR counts, Dependabot alerts, rate limit) is polled on a much slower cache TTL, deliberately - see Two cache tiers below.
CI status is tracked per active workflow, not per repo: checking
only the single most recent run across a repo's whole Actions history
would let a failing workflow hide behind a later, unrelated, successful
one (e.g. a broken Validate masked by a subsequent green Build).
Deliberately not included: per-job duration/queue-time metrics or run history beyond the latest one (GitHub's REST API has no org-wide "all workflow runs" endpoint, only per-repo/per-workflow, so anything beyond "latest run" would mean pulling full run history for every workflow in every repo).
Two cache tiers
| Runner status | Org/repo stats | |
|---|---|---|
| TTL | RUNNER_CACHE_TTL (default 30s) |
ORG_CACHE_TTL (default 5m) |
| Why | Genuinely real-time - a runner picking up a job matters within seconds | CI/PR/Dependabot signals don't change that fast, and cost 3 + N calls per repo per refresh (N = active workflow count) - polling that on a 30s TTL across a few dozen repos would burn through GitHub's 5,000/hour rate limit for no benefit |
Metrics
| Metric | Labels | Meaning |
|---|---|---|
github_runners_up |
1 if the last runner-status poll succeeded, 0 if a stale cache is being served | |
github_runner_up |
runner, os |
1 if the runner is registered and online, 0 if offline |
github_runner_busy |
runner, os |
1 if the runner is currently executing a job, 0 if idle |
github_org_up |
1 if the last org/repo stats poll succeeded, 0 if a stale cache is being served | |
github_org_repos_total |
visibility |
Number of non-archived repos, by public/private |
github_rate_limit_remaining |
Remaining core API rate-limit budget | |
github_rate_limit_limit |
Total core API rate-limit budget | |
github_repo_open_prs |
repo |
Number of open pull requests |
github_repo_ci_last_run_conclusion |
repo, workflow, url, conclusion |
Always 1 - an "info" metric. conclusion is GitHub's own string verbatim (success, failure, cancelled, skipped, neutral, timed_out, action_required, stale), not collapsed to pass/fail here - what counts as "actually broken" is a dashboard-level call. url links to the run on github.com. Absent if the workflow has never run |
github_repo_ci_last_run_timestamp_seconds |
repo, workflow |
Unix timestamp of that workflow's latest completed run |
github_repo_ci_last_run_duration_seconds |
repo, workflow |
Duration of that workflow's latest completed run |
github_repo_dependabot_alerts_open |
repo, severity |
Open Dependabot alerts by severity. Absent for a severity with zero open alerts |
Configuration
| Env var | Default | Required |
|---|---|---|
GITHUB_ORG |
yes | |
GITHUB_TOKEN |
yes — see Token permissions | |
LISTEN_ADDR |
:9222 |
|
GITHUB_REQUEST_TIMEOUT |
10s |
|
RUNNER_CACHE_TTL |
30s |
|
RUNNER_CACHE_MAX_STALE |
5m |
|
ORG_CACHE_TTL |
5m |
|
ORG_CACHE_MAX_STALE |
30m |
Token permissions
A fine-grained PAT needs:
- Repository access: All repositories — scoping it to a curated list means every repo-level metric (PRs, CI, Dependabot) silently only covers the repos you picked.
- Repository permissions: Metadata (read, auto-included), Pull requests (read), Actions (read), Dependabot alerts (read).
- Organization permissions: whatever GitHub's console offers for self-hosted runners (its REST API docs only document
admin:orgfor the classic-PAT path to that endpoint — narrower fine-grained scoping isn't guaranteed available for every org plan).
Build / test / run
go build ./...
go vet ./...
go test ./...
docker build -t github-actions-runner-exporter .
CI (.github/workflows/validate.yml) gates on the drumandbytes/reusable-actions
go-ci.yml lint job and a Docker smoke test (/healthz against fake credentials —
never a real GitHub org). The Trivy image scan runs separately (security.yml,
on PRs and weekly on main). build.yml pushes multi-arch
images to GHCR with SLSA provenance attestation on push to main/tags.
Grafana dashboard
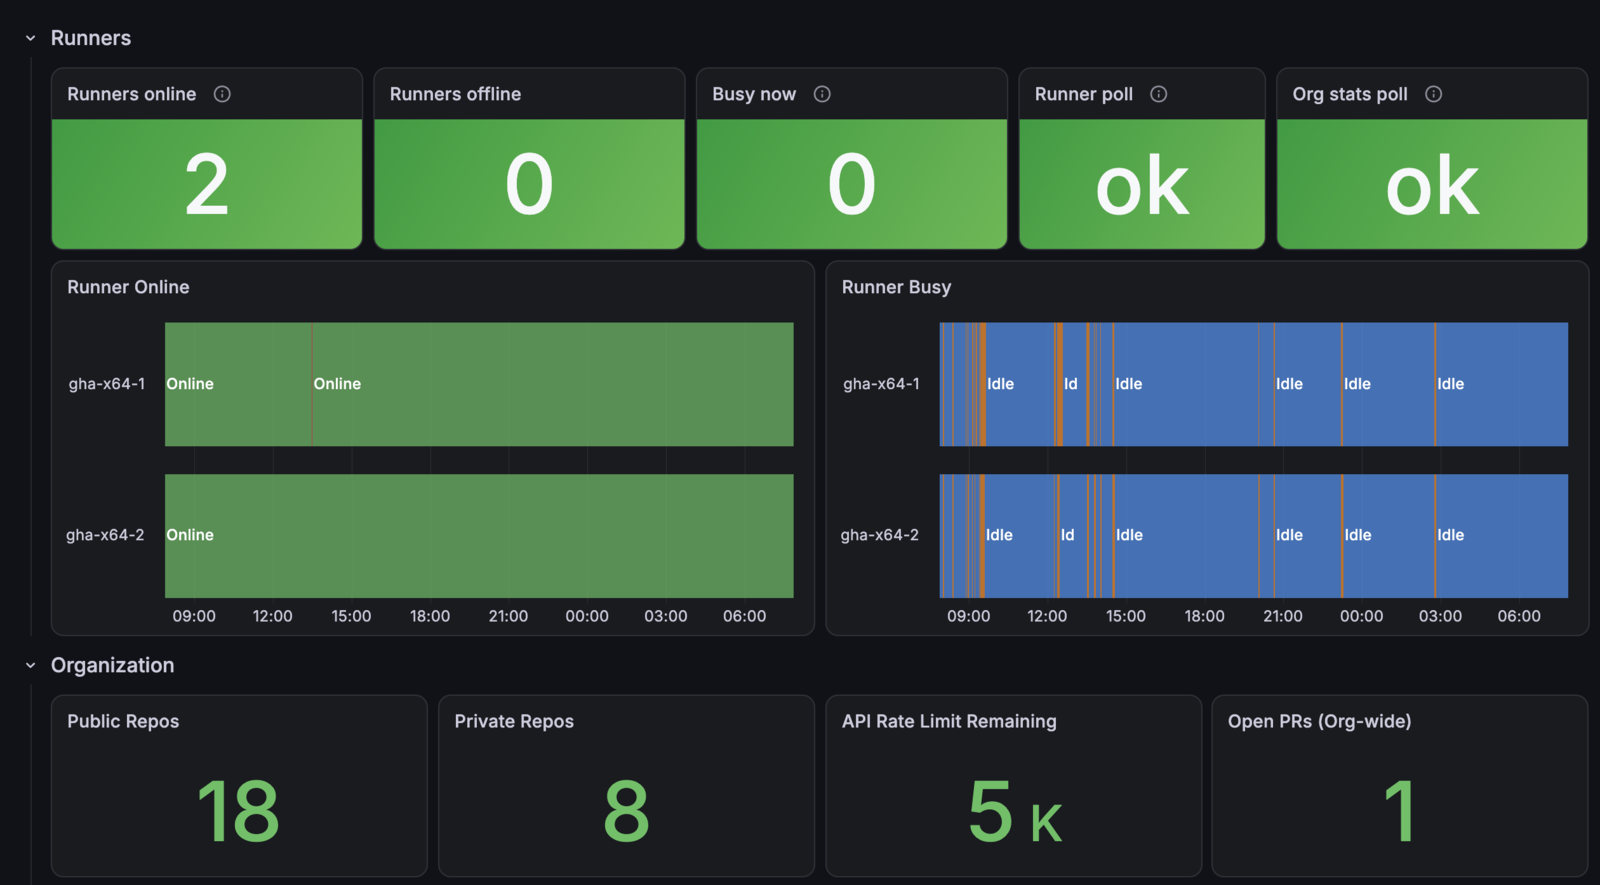
dashboards/github-actions-runner-exporter.json covers every metric above:
- runners online, offline and busy, with per-runner state timelines;
- both exporter polls' health, so a stale cache is visible;
- CI health per repo and workflow, open PRs, Dependabot alerts by severity, and the API rate limit.
Import it in Grafana (Dashboards → New → Import) and pick your Prometheus data source.
Alerting
alerts/github-actions-runner-exporter.rules.yml has ready-made Prometheus alerting rules. Add it under rule_files:, or paste its group into a PrometheusRule's spec.groups on kube-prometheus-stack.
| Alert | Fires when | Severity |
|---|---|---|
GithubRunnerOffline |
a registered runner is offline for 10m | warning |
GithubRunnersAllOffline |
every runner is offline for 5m | critical |
GithubRunnersSaturated |
every online runner has been busy for 30m (jobs are likely queueing) | warning |
GithubRunnerExporterStale |
the runner poll keeps failing (a stale cache is served) for 5m | warning |
GithubOrgStatsStale |
the org stats poll keeps failing for 30m | warning |
GithubApiRateLimitLow |
under 10% of the API rate limit is left for 10m | warning |
GithubWorkflowFailing |
a workflow's latest run failed or timed out, for 1h | info |
GithubDependabotCriticalAlerts |
a repo has open critical Dependabot alerts for 1h | warning |
GithubWorkflowFailing looks at each workflow's latest completed run on any branch, so it's info rather than paging. The thresholds are starting points. Every rule has unit tests in alerts/github-actions-runner-exporter.test.yml, run in CI with promtool test rules.
How it was made
Built with the help of an AI coding assistant (Claude). I review and test what gets published.
Install github-actions-runner-exporter on Unraid in a few clicks.
Find github-actions-runner-exporter in Community Apps on your Unraid server, review the template, and click Install. Unraid handles the Docker app or plugin setup from the published template.
Categories
Related apps
Explore more like this
Explore allDetails
ghcr.io/drumandbytes/github-actions-runner-exporter:latestRuntime arguments
- Web UI
http://[IP]:[PORT:9222]/metrics- Network
bridge- Privileged
- false
Template configuration
Metrics port (/metrics, /healthz).
- Target
- 9222
- Default
- 9222
- Value
- 9222
Organization whose runners to watch.
- Target
- GITHUB_ORG
Token with read access to org self-hosted runners; see the README.
- Target
- GITHUB_TOKEN