

bambulab-metrics-exporter
Docker app from BlackBush's Repository
Prometheus exporter for Bambu Lab 3D printers (local LAN or Bambu Cloud).
Requirements
A Secret Key (generate once: openssl rand -hex 32) to keep the saved connection across restarts.
Prometheus scraping port 9109 (keep bambulab in the job name for the dashboard).
Grafana with the ready-made dashboard (grafana.com ID 25033); its AMS filament panel needs the free Business Text plugin.
Overview
Readme
View on GitHub

Not affiliated with Bambu Lab.
bambulab_metrics_exporter
Python 3.11 GitHub Release Docker Publish GHCR Package GHCR Pulls Docker Hub Pulls Grafana Dashboard Downloads Ko-fi
A Prometheus exporter for Bambu Lab 3D printers. It runs as a small Docker container, reads your printer's live status on your home network or through Bambu Cloud, and publishes it for Prometheus to collect and Grafana to chart: prints, temperatures, fans, AMS filament, errors and firmware, with history and alerts. It only reads; it never controls the printer.
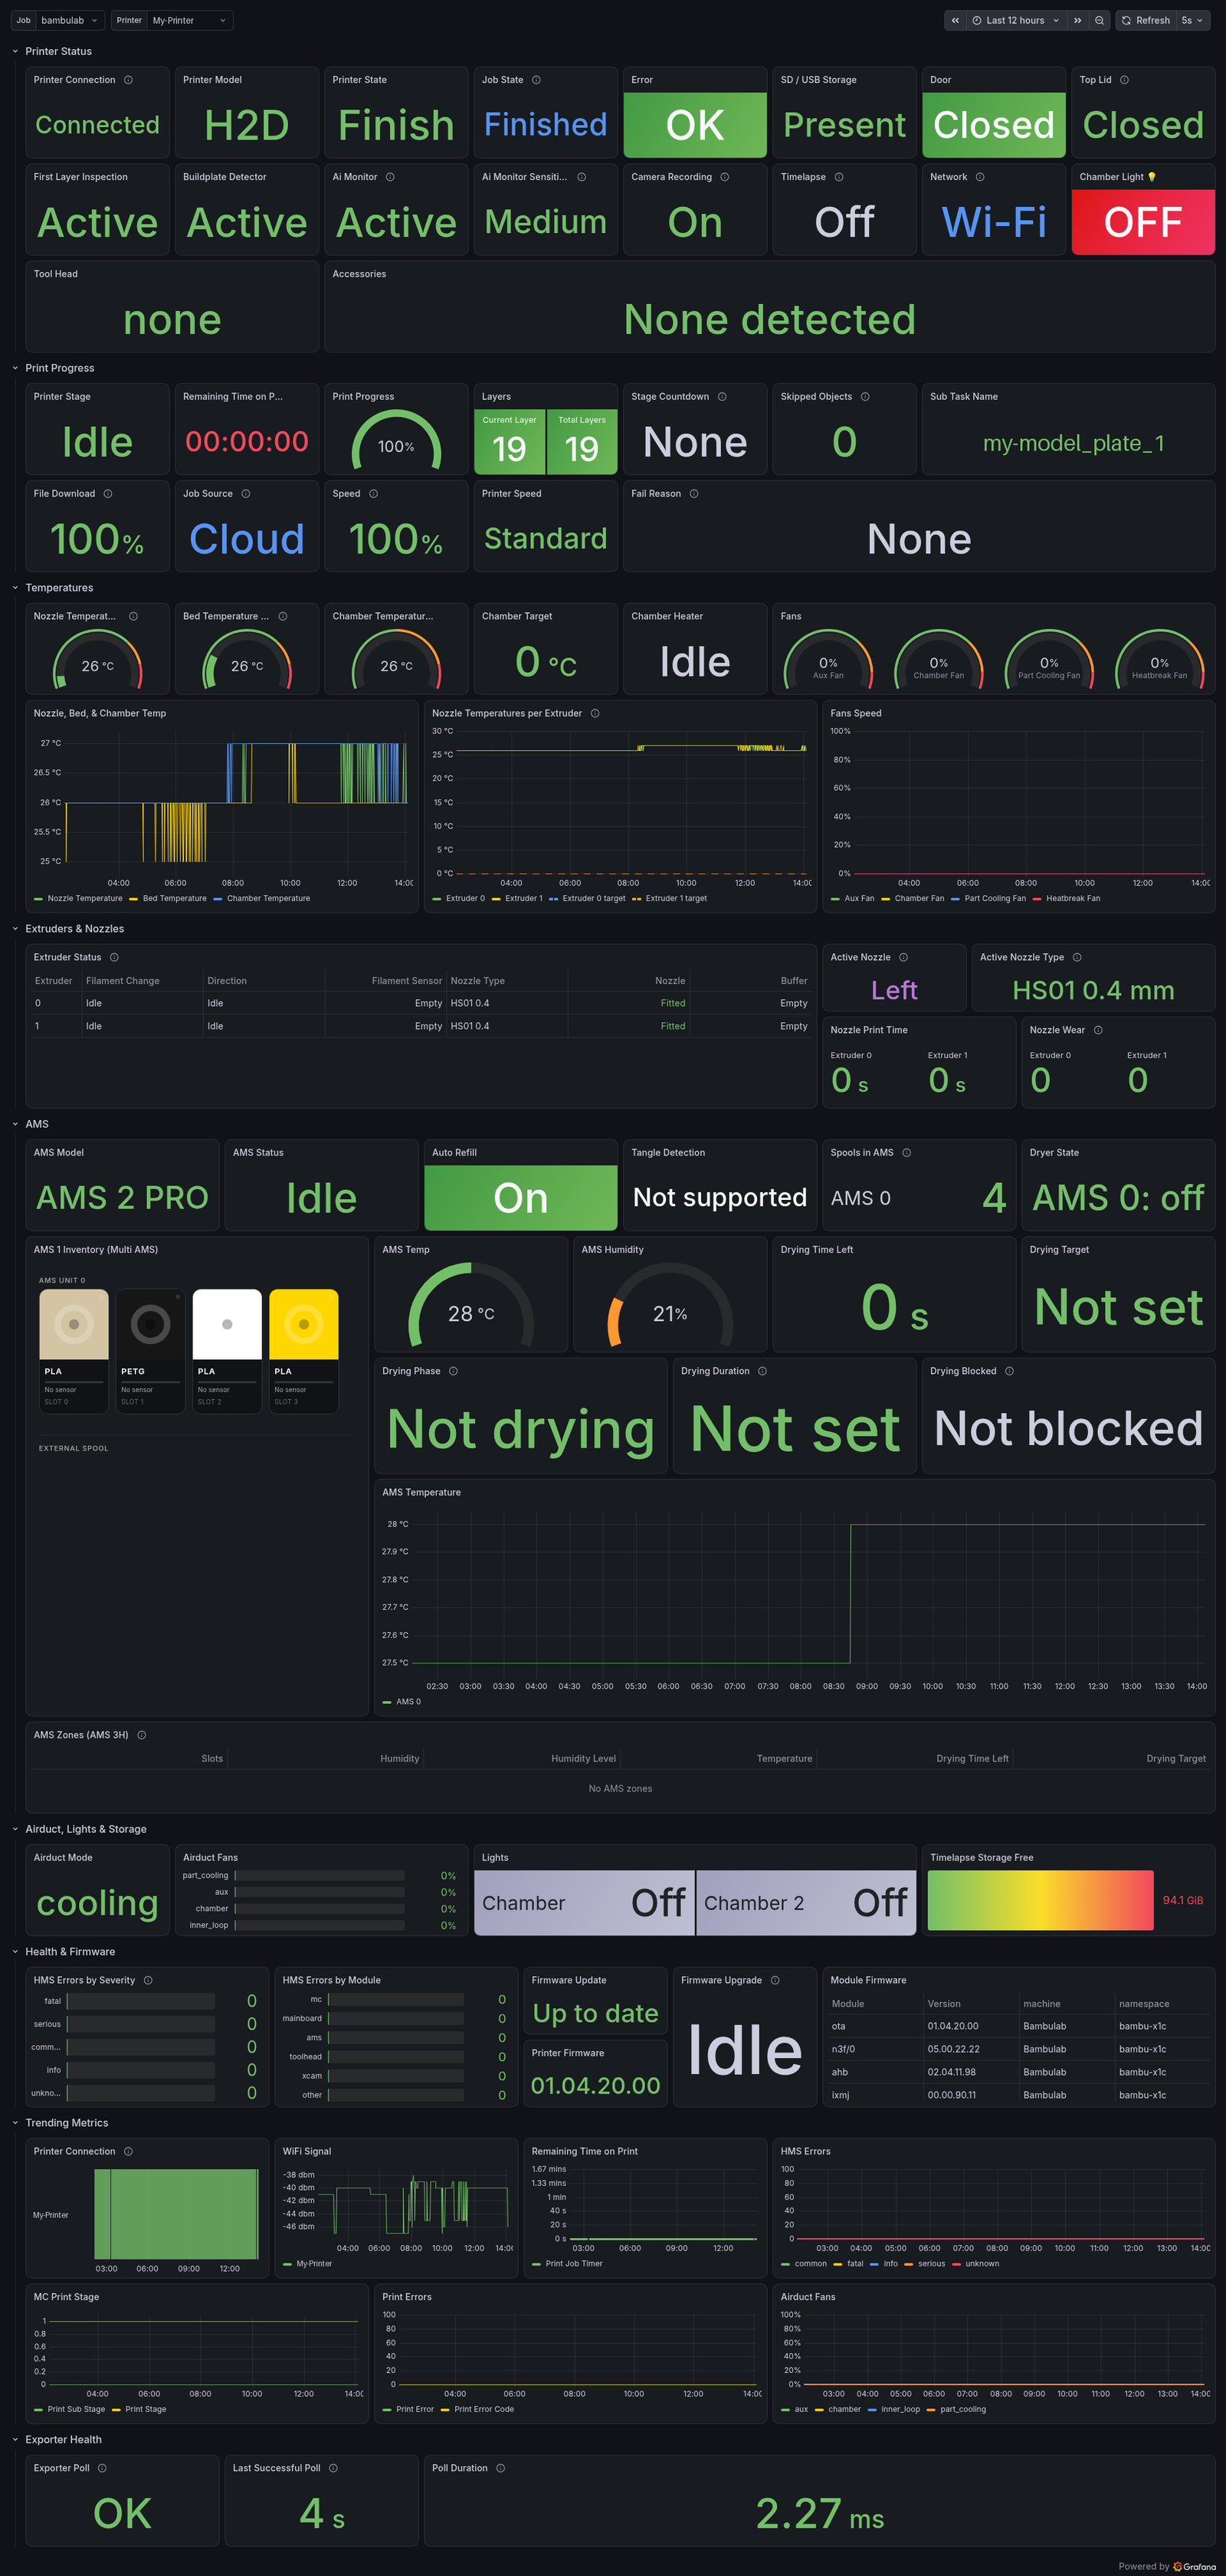
The ready-made Grafana dashboard (grafana.com ID 25033) with an H2D. Your dashboard shows your own printers.
Full documentation is in the wiki.
Contents
- Supported printers
- How it works
- Features
- Quick start
- Grafana dashboard
- Documentation
- Help and feedback
- Development
- License
Supported printers
| Series | Models | Tested on real hardware |
|---|---|---|
| A | A1, A1 mini, A2L | |
| P | P1P, P1S, P2S | |
| X | X1, X1 Carbon, X1E, X2D | X1 Carbon |
| H | H2C, H2D, H2D Pro, H2S, H3C | H2D (idle and printing) |
AMS units: AMS, AMS Lite, AMS 2 Pro, AMS HT and AMS 3H, plus the external spool.
Every model in the table is recognized, and the exporter leaves out metrics for hardware a model does not have (for example the chamber heater on a P1S). Models not yet tested on real hardware are recognized from their data and may report some values differently. The Metrics Reference lists what each model has.
Own a model that is not tested yet, or one marked "Unsupported printer"? Open the exporter's Diagnostics page and click Create GitHub issue. It sends a report with serial numbers, addresses, names and credentials removed, so the model can be checked or added.
How it works
Printer (LAN or Bambu Cloud) -> exporter :9109/metrics -> Prometheus -> Grafana
Bambu Lab printers publish their state over MQTT. The exporter listens to that feed, asks for a full update every 10 seconds, and turns it into Prometheus metrics.
| Connection | What you provide | Good to know |
|---|---|---|
| Local (LAN) | Printer IP address, serial number and LAN access code (on the printer: Settings, Network) | Talks to the printer directly; no Bambu Cloud account needed |
| Bambu Cloud | Your Bambu Lab account email and the code it emails you, then tick the printers to monitor | No IP or access code needed; the login renews itself and is stored encrypted |
You set up both in your browser on the exporter's Printer Connection page (/auth), and you
can mix them: one exporter monitors up to 32 printers.
Features
Printer status
Connection, state and stage, HMS errors by severity, door and top lid, lights, camera, Wi-Fi or wired network, SD card or USB drive, mounted tool head and accessories, firmware versions and available updates.
Print progress
Percent, layers, time left, stage countdown, job source, file download progress, skipped objects and fail reason.
Temperatures and fans
Nozzle (per extruder, and the active one on dual-nozzle printers), bed and chamber with their targets, every fan, and the airduct mode.
AMS and filament
AMS model and status, filament type, color and remaining amount per slot, humidity and temperature, and drying (time left, target, phase and why drying cannot start). On the AMS 3H these are per zone.
Extruders and nozzles
Filament change steps, filament sensors and buffer, nozzle type, diameter and wear, and the hotend rack on the H2C and H3C.
Built for homelabs
- Easy setup: connect printers in the browser; settings are stored encrypted and survive restarts.
- Model aware: detects the model and skips hardware it does not have.
- Diagnostics: a built-in page builds a sanitized report and opens a prefilled GitHub issue.
- Read-only: never sends control commands to the printer.
- Ready to use: Grafana dashboard, Prometheus alert and recording rules, and an Unraid template.
Quick start
You need a machine that runs Docker, and Prometheus and Grafana to store and chart the data.
Create a secret key once and keep it safe. It encrypts the saved printer settings and cloud login:
openssl rand -hex 32Start the container:
docker run -d \
  --name bambulab-exporter \
  --restart unless-stopped \
  -p 9109:9109 \
  -v /path/to/config:/config/bambulab-metrics-exporter \
  -e BAMBULAB_SECRET_KEY=<your-secret-key> \
  ghcr.io/theblackbush/bambulab_metrics_exporter:latest
Open
http://<your-server-ip>:9109/auth, choose Local or Bambu Cloud, and connect. No restart is needed.Add
<your-server-ip>:9109as a Prometheus scrape target (keepbambulabin the job name) and import Grafana dashboard 25033.
The image is also on Docker Hub as blackbush/bambulab_metrics_exporter, and an Unraid template
is available. Docker Compose, Unraid and environment-variable setup are in the wiki:
Quick Start and
Installation.
The exporter's pages have no password of their own. Keep port 9109 on your home network.
Grafana dashboard
BambuLab Metrics on
grafana.com (ID 25033), also in examples/grafana/:
| Row | What it shows |
|---|---|
| Printer Status | Connection, model, state, errors, door, lid, lights, AI features, tool head, accessories |
| Print Progress | Stage, time left, progress, layers, job name, speed, fail reason |
| Temperatures | Nozzle, bed and chamber gauges scaled to the model, fans and trends |
| Extruders & Nozzles | Per-extruder status, active nozzle, nozzle wear |
| AMS | Spool cards with real filament colors, humidity, temperature, drying, AMS 3H zones |
| Airduct, Health & Trends | Airduct fans, HMS errors, firmware per module, connection and Wi-Fi history |
Use the Job and Printer dropdowns to switch printers. The AMS spool cards need the free Business Text plugin; see the Grafana Dashboard guide.
Documentation
| Page | What it covers |
|---|---|
| Quick Start | Step-by-step setup and the /auth connection page |
| Installation | Docker, Docker Compose, Unraid and environment-variable setup |
| Configuration | Every environment variable |
| Prometheus Setup | Scrape config, alert and recording rules |
| Grafana Dashboard | Import steps and panels |
| Metrics Reference | Every metric, per-model support and PromQL examples |
| Troubleshooting | Common problems and fixes |
| Diagnostic Report | The report to send with issues for new printers, metrics or fixes |
How the exporter works in detail and its known limitations are on the
wiki home page. Release notes
are in CHANGELOG.md, and examples (dashboard JSON, Prometheus rules, sample output)
in examples/.
Help and feedback
- Something wrong or missing? Run the Diagnostics page and click Create GitHub issue, or open an issue yourself. The Troubleshooting page covers the common problems.
- Running several printers in one exporter? This has only been tested with simulated printers, so feedback is very welcome: tell us your printer models and whether they use cloud or LAN.
Development
The project ships as a Docker image only (no PyPI package). To run the tests:
python3 -m venv .venv
.venv/bin/python -m pip install -r requirements-dev.txt && .venv/bin/python -m pip install -e .
make test   # full suite with coverage gate
make lint
To build the image locally: docker build -t bambulab-metrics-exporter:latest .
License
Media gallery
Categories
Related apps
Explore more like this
Explore allLinks
Details
ghcr.io/theblackbush/bambulab_metrics_exporter:latestRuntime arguments
- Web UI
http://[IP]:[PORT:9109]/- Network
bridge- Shell
sh- Privileged
- false
Template configuration
Host port for the web UI and /metrics.
- Target
- 9109
- Default
- 9109
- Value
- 9109
Stores the encrypted /auth page settings and cloud credentials.
- Target
- /config/bambulab-metrics-exporter
- Default
- /mnt/user/appdata/bambulab-metrics-exporter
- Value
- /mnt/user/appdata/bambulab-metrics-exporter
Encrypts the settings and cloud login saved by the /auth page so they survive restarts. Generate once (openssl rand -hex 32) and keep it; changing it means connecting again.
- Target
- BAMBULAB_SECRET_KEY
Optional. local_mqtt (LAN) or cloud_mqtt (Bambu Cloud). Ignored once a connection is saved on the /auth page.
- Target
- BAMBULAB_TRANSPORT
- Default
- local_mqtt|cloud_mqtt
- Value
- local_mqtt
Optional. Printer serial number; leave empty to set it on the /auth page.
- Target
- BAMBULAB_SERIAL
Optional, local_mqtt only. Printer IP or hostname; leave empty to set it on the /auth page.
- Target
- BAMBULAB_HOST
Optional, local_mqtt only. LAN access code from the printer (Settings, Network); leave empty to set it on the /auth page.
- Target
- BAMBULAB_ACCESS_CODE
local_mqtt only. Keep 8883.
- Target
- BAMBULAB_PORT
- Default
- 8883
- Value
- 8883
local_mqtt only. Keep bblp.
- Target
- BAMBULAB_USERNAME
- Default
- bblp
- Value
- bblp
Optional, cloud_mqtt only. For the env-variable login flow: the container emails a verification code to this address. Not needed when you log in on the /auth page.
- Target
- BAMBULAB_CLOUD_EMAIL
Optional, cloud_mqtt only. Legacy: the emailed verification code for the env-variable flow; remove it after login. Logging in on the /auth page is easier.
- Target
- BAMBULAB_CLOUD_CODE
Optional, cloud_mqtt only. Only for manually obtained tokens; leave empty.
- Target
- BAMBULAB_CLOUD_USER_ID
Optional, cloud_mqtt only. Only for manually obtained tokens; leave empty.
- Target
- BAMBULAB_CLOUD_ACCESS_TOKEN
Optional, cloud_mqtt only. Only for manually obtained tokens; leave empty.
- Target
- BAMBULAB_CLOUD_REFRESH_TOKEN
cloud_mqtt only. Bambu Cloud MQTT broker; keep the default unless your account uses another region.
- Target
- BAMBULAB_CLOUD_MQTT_HOST
- Default
- us.mqtt.bambulab.com
- Value
- us.mqtt.bambulab.com
cloud_mqtt only. Keep 8883.
- Target
- BAMBULAB_CLOUD_MQTT_PORT
- Default
- 8883
- Value
- 8883
Optional. printer_name label for the env-var printer only, not for printers added on the /auth page; leave empty to use the printer name from the printer or Bambu Cloud.
- Target
- PRINTER_NAME_LABEL
true: ask the printer for a full status report every poll (read-only). false: only listen to updates the printer sends on its own.
- Target
- BAMBULAB_REQUEST_PUSHALL
- Default
- true|false
- Value
- true
Seconds between polls.
- Target
- POLLING_INTERVAL_SECONDS
- Default
- 10
- Value
- 10
Seconds to wait for a printer report each poll.
- Target
- REQUEST_TIMEOUT_SECONDS
- Default
- 8
- Value
- 8
Extra host names allowed for the /auth and /diagnostics pages, comma separated (for example a reverse-proxy name). IP addresses and local names are always allowed.
- Target
- AUTH_ALLOWED_HOSTS
Log verbosity.
- Target
- LOG_LEVEL
- Default
- INFO|DEBUG|WARNING|ERROR
- Value
- INFO
User ID the exporter runs as (Unraid: 99).
- Default
- 99
- Value
- 99
Group ID the exporter runs as (Unraid: 100).
- Default
- 100
- Value
- 100
File creation mask.
- Default
- 002
- Value
- 002
HTTP bind address inside the container. Keep 0.0.0.0.
- Target
- LISTEN_HOST
- Default
- 0.0.0.0
- Value
- 0.0.0.0
HTTP port inside the container. Keep 9109; to use another port on the server, change Web UI Port instead.
- Target
- LISTEN_PORT
- Default
- 9109
- Value
- 9109
Config path inside the container; must match the Config Dir container path.
- Target
- BAMBULAB_CONFIG_DIR
- Default
- /config/bambulab-metrics-exporter
- Value
- /config/bambulab-metrics-exporter
Encrypted credentials file name in the config directory.
- Target
- BAMBULAB_CREDENTIALS_FILE
- Default
- credentials.enc.json
- Value
- credentials.enc.json